
What drives moves in the building blocks of bond yields?
This section contains a discussion of some of the variables which could explain movements in the sub-components of bond yields. These were found to share a significant statistical relationship with their respective sub-components of bond yields. The direction of the relationship (that is, whether the variable and yield sub-component were positively or negatively correlated) were almost always consistent with what would be expected as per the intuition outlined in Tables 1 to 4 below. Further details on the variables are available in the Appendix.
Real rates risk premium (‘RRRP’)
Table 1 and Graph 1 set out some of the potential factors which could explain the real interest rates risk premium. Investors may seek this compensation when buying a longer-term bond rather than a series of shorter-term bonds if they are concerned about the possibility that outcomes for short-term real interest rates may differ from expectations.
Table 1 – Drivers of the RRRP
| Factor | Intuition |
| Policy rates risk | Uncertainty around the path for real policy rates should influence market perceptions about the risk around expected short-term real interest rates over the life of a bond. |
| Gross supply risk | Uncertainty about how much bond supply may come to market could create concerns that bond prices may need to adjust so that this supply can be absorbed. |
| Liquidity risk | Investors want to be able to transact without this distorting the current price of a security. The liquidity of a security represents how easily this can be done. If bonds are more liquid, then investors may accordingly demand less compensation to invest in these (and vice versa for less liquid bonds). |
| Other market risk | Uncertainty over the outlook for bonds that remains after accounting for factors that could impact real yields (listed above) could affect the compensation that investors demand for holding these securities. |
Graph 1 – Factors which explain real rates risk premiums
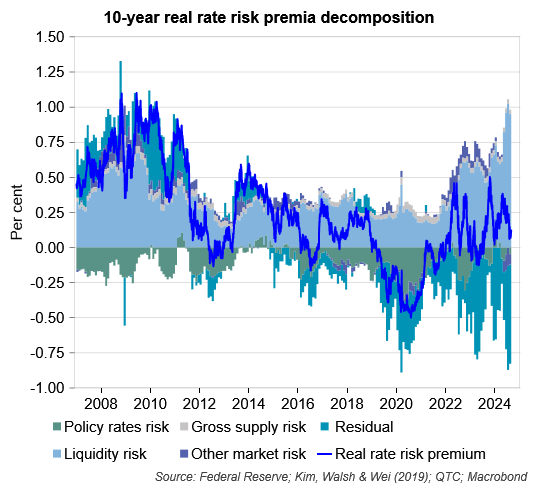
There are a few key observations that can be made from the US Treasury 10-year bond yields analysis in Graph 1.
Firstly, perceived risks to policy rates generally lowered the RRRP over the period of analysis. This reflects that inflation was low during this period. This meant that the risk that interest rates would need to be lifted sharply in response was diminished. As such, investors didn’t need to demand compensation to account for this possibility. As would be expected, the negative impact of this factor has subsided as the balance of risks around inflation and policy rates shifted to the upside in recent years.
Secondly, over this period the US Government budget was in deficit and by fairly similar amounts from one year to the next. This lowered the risk of large unanticipated increases in bond supply (represented by the grey bars) to the RRRP.
Thirdly, variations in levels of US Treasury market liquidity coincided with shifts in the compensation that investors required for holding longer-term bonds rather than a series of shorter-term instruments (represented by the light blue bars).
Fourthly, other market risks (that is, the extent to which future expected bond market moves are influenced by risks other than those noted above) generally made a small positive contribution to the RRRP (represented by the purple bars).
Finally, there were some periods (for example, at the onset of COVID when bond market functioning was impaired) that the model is unable to fully explain the RRRP. At these times the model’s ‘residual’ – that is, the component of the risk premium that it couldn’t explain – was large (represented by the aqua bars).
Inflation risk premium (IRP)
Table 2 and Graph 2 set out some of the variables that could explain the risk premium that investors in nominal bonds demand to bear inflation risk.
Table 2 – Drivers of the IRP
| Factor | Intuition |
| Inflation uncertainty | Uncertainty over future inflation outcomes should see investors demand compensation for bearing this inflation risk. |
| Market uncertainty | General uncertainty around the outlook for future changes in bond yields, even unrelated to that due to inflation, appears to have a relationship with inflation risk premiums. |
| Inflation expectations | The higher the expectations for inflation are from market participants relative to trend, the greater the perceived risk of higher outcomes relative to the usual experience. |
Graph 2 – Factors which explain inflation risk premiums
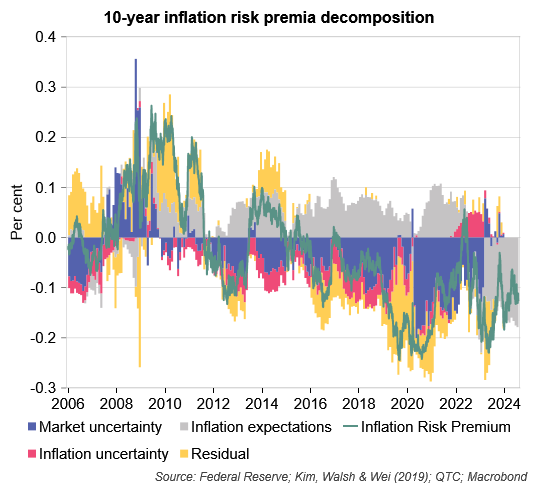
Some of the observations that can be drawn from this analysis in Graph 2 are set out below.
Firstly, with inflation generally low and stable during the period covered by the analysis, so too has been uncertainty around future inflation outcomes (represented by the red bars). This means that investors haven’t had the need to seek much additional compensation to account for the risk of higher potential inflation outcomes. This changed during the post-COVID inflation spike, although has since normalised in line with the moderation of inflation.
Secondly, uncertainty around the outlook for bond yields that is unrelated to that due to inflation (represented by the purple bars) tends to drive the IRP higher during periods of market volatility (for example, the GFC, the onset of COVID-19, and the concerns around US regional banks in early 2023). Equally, in calmer periods – including during the Federal Reserve’s large scale asset purchase programmes (QE) – this factor pushed the IRP lower.[1]
Thirdly, market inflation expectations have generally been above trend inflation, which suggests that investors have felt the need to seek compensation for the risk that future outcomes are higher than those which have been observed over time. This measure of inflation uncertainty is derived from market expectations and is different to the other one used in this exercise which is more model based. It therefore provides an important additional perspective on inflation uncertainty.
Finally, mismeasurement of these concepts or the omission of other important factors do leave a significant unexplained component of the IRP (represented by the yellow bars).
Expected real interest rates
Table 3 and Graph 3 set out some of the potential factors which could explain investors’ expectations for real interest rates.
Table 3 – Drivers of expected real interest rates
| Factor | Intuition |
| Real policy rate expectations | Median expectations for real policy rates should provide a good sense of expected short-term real interest rates. |
| Net supply expectations | Beyond interest rate policy, government fiscal and central bank balance sheet policies could also influence expectations over how short-term real interest rates might evolve. Net bond supply in this context refers to expectations of the volume of Treasury bonds to be issued less the amount anticipated to be purchased by the Federal Reserve as part of any asset purchase programs. |
Graph 3 – Factors which explain expected real interest rates
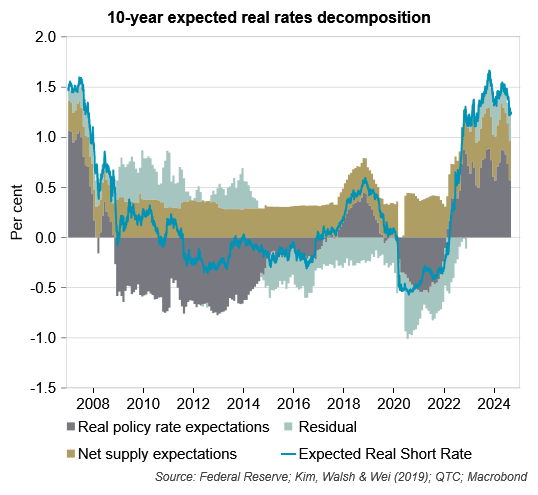
Some of the observations that can be drawn from the analysis in Graph 3 is set out below.
Firstly, real policy rate expectations make a significant contribution to expected real interest rates (represented by the dark grey bars) during different phases of the policy cycle.
Secondly, net supply expectations typically add around 30 to 40 basis points to expected short-term real interest rates (represented by the brown bars).
Thirdly, there are elements of expected real interest rates that cannot be accounted for by the model (represented by the blue-green bars) with these both adding and subtracting from these at different points in time.
Expected inflation
Table 4 and Graph 4 set out some of the potential factors which could explain financial market inflation expectations.
Table 4 – Drivers of expected inflation
| Factor | Intuition |
| Trend inflation | Long-term inflation expectations share some relationship to the trend in inflation.[2] |
| Volatile items | There is evidence that market-based measures of long-term inflation expectations are influenced by volatile short-term price movements (such as those in crude oil prices). |
Graph 4 – Factors which explain expected inflation
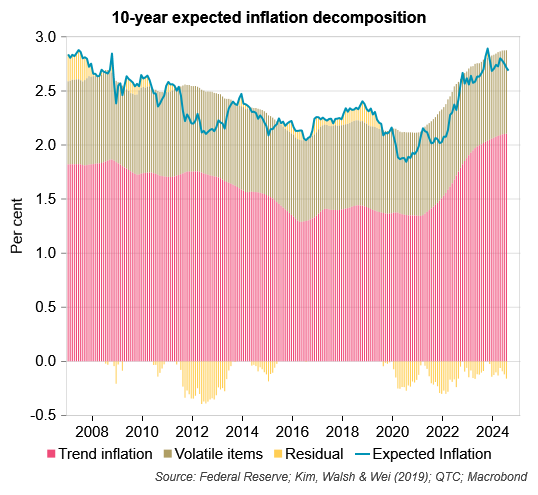
The key observations from the analysis in Graph 4 is that trend inflation (represented by the red bars) explains most of expected inflation, though price moves for volatile items (represented by the beige bars) seem to also impact longer-term expectations.
Conclusion
This piece is the third in a series on bond yields. The first provided a high-level overview of the components and sub‑components that make up yields, the second looked at estimates of and trends in the sub-components, and this note examined what might be behind the moves in these. This analysis is useful to gain further insights on what might be behind movements in bond yields by focussing on what is driving shifts in the different sub-components of yields.
Taking the period since the COVID-19 era trough as an example, this analysis points to the subsequent rise in yields as being due to several factors, including:
- Real interest rate expectations
- Increased expectations for real policy rates pushed up expectations for real interest rates.
- Inflation expectations
- A rise in trend inflation pushed up expectations for inflation.
- Real interest rate risk premium
- Uncertainty around the path for real policy rates started to increase as the Federal Reserve began to lift interest rates in early 2022. That is, after having been at zero for a period, there were now a range of positive outcomes for markets to consider. The possibility that real policy rates could rise by more than expected led investors to demand an extra premium to account for this risk.
- Weaker liquidity conditions in US Treasury markets also saw investors demand additional compensation for risks around real interest rates.
- Inflation risk premium
- Uncertainty around inflation made its most substantial contributions to the inflation risk premium until around the time that inflation peaked in mid-2022.
- Market expectations for inflation relative to trend inflation rose following the COVID-19 shock. This pointed to market participants becoming more concerned about future inflation which may have pushed up the inflation risk premium. This effect has reversed since inflation peaked in mid-2022.
- Less uncertainty about the outlook for bond yields – independent of any uncertainty to do with inflation – pushed up the inflation risk premium. More work is needed to understand this effect.
While this analysis is useful to get a sense of what might be behind movements in the different sub-components of bond yields, it is important to note that there remains a reasonable amount of variation in the sub-components that cannot be explained by the variables examined. Further research in this area could therefore be beneficial.
The next two notes in this series will provide deep dives into topical factors which could influence the two components of bond yields, expectations for interest rates and a risk premium to account for uncertainty around these.
Footnotes
[1] When the outlook for bonds is uncertain (‘market uncertainty’) investors should demand compensation for this. Stripping out the impact of inflation uncertainty should allow for an assessment of how general uncertainty over the outlook for bonds can influence the IRP. In principle, with the impact of inflation uncertainty removed, general market uncertainty should have little impact on the IRP. However, this assumes that the measure used to capture inflation uncertainty does so comprehensively and that the estimates of the IRP accurately depict the compensation demanded for inflation risk. Measurement error is possible for each which means that, in practice, market uncertainty – purged of the impact of inflation uncertainty – could still impact the IRP. This appears to be the case with this purged series having a statistically significant positive relationship with the IRP. The theoretical basis for such a relationship is unclear, though that there appears to be one in an applied sense, suggests that it warrants further investigation. It could be that either the measure of inflation uncertainty is incomplete, or the IRP estimate is picking up compensation related to non-inflation factors (or both).
[2] This paper highlights the relationship between long-term survey-based measures of inflation expectations and trend inflation. However, in doing so it notes that the latter cannot be directly equated with the former.