Taking a longer-term view
Forecasting bond yields presents significant challenges due to the influence of various short-term factors. For example, expectations for real policy rates change as conditions evolve through the economic cycle and inflation expectations can be impacted by shifts in the prices of volatile items.[1] Equally, issues may emerge that prompt investors to modify how much compensation they demand for the risk that their central expectations for real short-term interest rates and inflation are not realised. It is often difficult to anticipate what these issues might be, though one possible candidate – the US fiscal trajectory – was discussed in note five in this series. Finally, technical market factors such as changes in liquidity or positioning could lead to unpredictable fluctuations in bond yields. Graph 1 highlights the challenging nature of forecasting bond yields and reveals that accurate predictions are more the exception than the rule.
Graph 1 – Economist forecasts of US Treasury 10-year yields (per cent)

Long-term projections for US and Australian Government bond yields
Focussing more on how yields might evolve in the absence of these short-term factors can provide a clearer sense on the broader trends impacting yields over time.
There are many ways to approach projecting bond yields over an extended time horizon. In terms of what variables to include in the analysis, a simple and helpful framework to consider might be as follows:
- Corporate finance theory suggests that a firm should not undertake an investment if the return from this is less than the cost of funding it (based on the firm’s weighted average cost of capital). This implies that an optimal level of investment may be achieved at the point when the return on capital is equal to the cost of capital.
- Assuming firms only finance capital investment using debt, then there will be an interest rate which matches the supply of savings available to fund investment with the demand for investment itself. This is the real (that is, inflation adjusted) interest rate which ensures that the market for loanable funds is in equilibrium. It represents the longer-term component of equilibrium interest rates and is known as the ‘natural rate’.[2] It can be taken as representing the cost of capital in the long-term if firms only finance capital investments via debt.
Mapping this illustrative example across from the firm level to the broader economy reveals that:
- Given how changes in the natural rate flow through to bond yields, a broader proxy for the cost of capital might be the yield on the national governments’ 10-year bond. Similarly, a broader proxy for the return on investment is growth in potential GDP.[3]
- Taking Australia as an example and looking at things in real terms, there is a correlation between potential growth and government 10-year bond yields (at least outside the COVID-19 period). Therefore, it appears reasonable to conclude that changes in a nation’s return on capital and its government’s cost of capital move together (Graph 2).
Graph 2 – A framework to think about drivers of bond yields over the long-term

This correlation suggests that potential GDP growth as well as the variables which impact it could be used to explain and project real, but also nominal, government bond yields.[4] Fortunately, for these variables – as well as others which could influence bond yields – there are projections going out decades into the future. This allows for projections of bond yields to be made over an extended horizon, assuming the relationship between these variables and bond yields holds in the future as it has in the past. This is a simplifying assumption, but a necessary one.
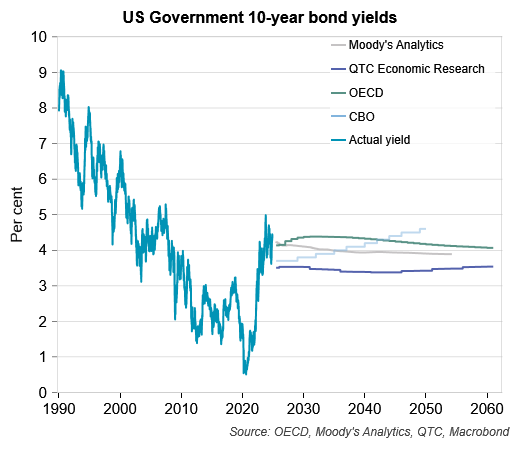
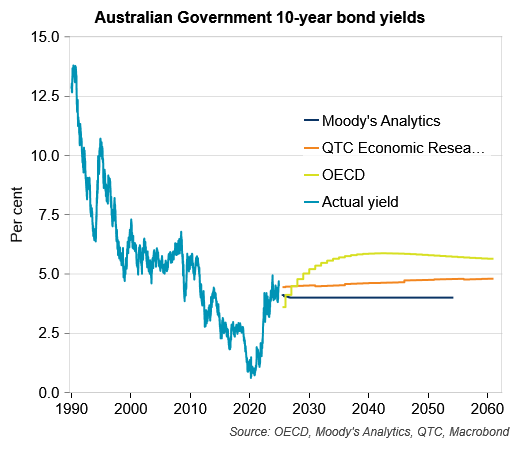
Graphs 3 and 4 highlight the results of this approach for the 10-year bond yields for the US and Australian Governments respectively. Projections from other forecasters are also included. US yields are generally seen as trending sideways over the coming decades while those for Australia are anticipated to drift slightly higher. The broad picture that emerges is that yields should move in a fairly range bound fashion. However, this assessment is based only on the structural drivers of yields and how these are expected to evolve over time. It ignores the likelihood that short-term cyclical drivers can have more pronounced effects on yields. It does this as these are difficult to accurately anticipate in advance, especially as the forecast horizon stretches further into the future.
The value of these projections is that they provide a useful anchor for thinking about where yields may go over the longer-term based on the structural variables which influence them over these extended horizons. The limitations of the projections are that they will not give precise forecasts for yields. However, this was not the intent. Indeed, given how hard it is to forecast the noisy short-term factors which can impact yields, incorporating factors which are far more volatile and uncertain was deliberately avoided.
Graph 3 – US Government 10-year bond yields, Actual & Projected
Graph 4 – Australian Government 10-year bond yields, Actual & Projected
Assessing how equilibrium interest rates might evolve over the long-term
As discussed above, it is challenging to accurately forecast bond yields in the near-term. Taking a longer-term view offers the opportunity for a less noisy, albeit partial, perspective of where yields may be going. Most of the variables used to project yields over the longer horizon in this note are related to potential GDP growth. This also happens to be a variable whose different components feature prominently in the estimation of equilibrium interest rates through their influence on the natural rate (see note four in this series for more). Given how shifts in equilibrium interest rates can flow through to bond yields, it is worth considering how these might evolve over the period ahead also.
As markets are forward looking, it is expectations for equilibrium interest rates that can impact bond yields.[5] In this section, projections of expected equilibrium interest rates (‘neutral rates’) are presented. These are the sum of projections for the two components of these, the longer-term (natural rate) and the shorter-term component. These represent the impact on equilibrium interest rates from short and long-lived factors (see note four in this series).
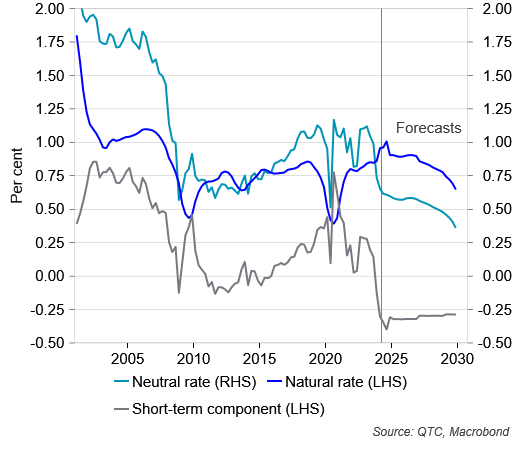
Projections for the natural rate are possible as these are available for the series used to estimate the longer‑term component. Forecasts for the shorter-term component were calculated by considering how certain variables[6] have explained this in the past and then, using these estimated relationships as well as some assumptions or forecasts for how these variables might evolve in the future to project forward. The projections for the long and short-term components were added together to get those for the neutral rate (see Graphs 5 & 6 for the US and Australia respectively).
Graph 5 – Equilibrium interest rate projections (US)
Graph 6 – Equilibrium interest rate projections (Australia)
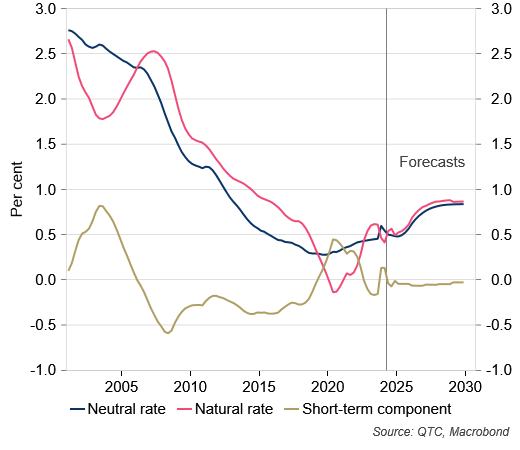
The projections for neutral rates presented in the graphs above are largely a function of those for the natural rate. The latter are closely correlated with how potential GDP growth and its key components (that is, growth in the labour force and its productivity) are expected to evolve.
For the US, the neutral rate is estimated to have recently begun to decline. This could be related to a normalisation of population growth and fiscal spending following the COVID-19 pandemic. Going forward, a more modest outlook for potential growth could take the neutral rate lower still. However, this outlook – which is largely a function of OECD projections that US labour productivity growth will continue to moderate – might be overly pessimistic. For example, it is at odds with the prospect that artificial intelligence could boost productivity and potential GDP growth with this possibility arguably most realistic for the US given how advanced it is in AI development. However, perhaps this impact may not have been fully incorporated yet with the technology still in its infancy.
In contrast, labour productivity growth is set to accelerate in Australia under the OECD’s projections. This pushes potential GDP growth higher, and if these projections are realised, they imply a higher natural rate. With little change anticipated in the short-term component based on the outlook for factors thought to explain this, the rise in the natural rate could flow through to higher neutral rates. It is also worth considering alternate scenarios for potential GDP growth in Australia given how this could impact estimates of natural and consequently, neutral interest rates.
Graph 7 – Neutral rate vs potential GDP growth projections (all axes are per cent)
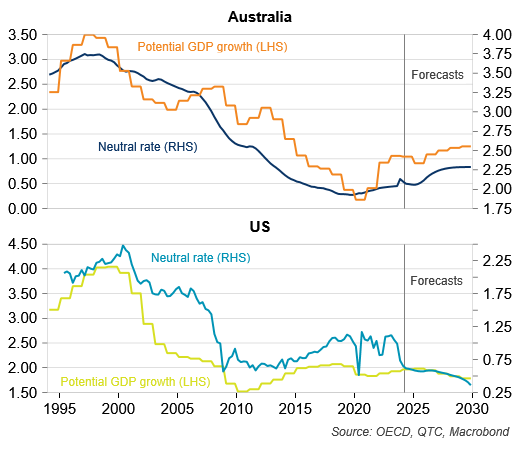
While projections of structural variables over the long-term can be more reliable due to their relative stability compared to short-term drivers, uncertainty remains a challenge when looking so far into the future. This means that caution is required when assessing any quantitative projections of the neutral rate based on these variables, including those in this note.
As such, there could be value in cross-checking this outlook by undertaking a qualitative assessment of the factors that could impact the neutral rate (and ultimately bond yields) over the period ahead. In one respect this is needed as it is difficult to anticipate ahead of time the types of shocks that could drive the short-term component of equilibrium interest rates. Equally, gaining insight into how neutral rates might evolve going forward requires a consideration of what factors could impact the natural rate. While the analysis above was quantitative in nature, this can also be done qualitatively. This analysis is set out in Table A1 of the Appendix.
The findings of the analysis referred to above, provide that roughly two-thirds of the potential drivers of natural rates in Australia suggest these might move lower in the coming years. This is at odds with the quantitative analysis which point to it possibly increasing in the period ahead. However, the qualitative analysis doesn’t identify which factors might be more important catalysts for moves in the natural rate or the materiality of their impact. Regardless of approach, it is vital to recognise this uncertainty when evaluating how equilibrium interest rates and bond yields may evolve over time.
Conclusion
This piece is the sixth and final in a series on bond yields. The first provided a high-level overview of the components and sub-components of bond yields. The second looked at trends in these over time while the third examined what factors could be behind changes in the sub-components. The fourth and fifth notes looked at topical issues which could impact the key components of bond yields, expected short-term real interest rates and the risk (or ‘term’) premium, respectively.
This note set out projections for Australian and US Government bond yields over the next few decades and, given a degree of commonality in the variables which might impact both yields and equilibrium interest rates over the long‑term, some projections for the latter were also presented. This is a partial analysis of the outlook for bond yields in that it focusses on the long-term structural drivers of these given the inherent difficulty in forecasting short-term cyclical dynamics. It shows where we might expect yields to settle if the economy were in equilibrium. In Australia, the projections pointed to the possibility of both neutral rates and bond yields increasing over time. Meanwhile, in the US, bond yields were projected to trend sideways and equilibrium interest rates lower. For the US, the divergence between the two could reflect various factors. One possibility could be a higher risk premium on Treasury bonds due to the trajectory of public debt (see the fifth note in the series for more). Finally, it should be noted that the projections are sensitive to the assumptions used. As such, there remains considerable uncertainty over the outlook for yields, even if this might be somewhat less than what might be associated with forecasting exercises focussed on the shorter-term.
Footnotes
[1] See Graph 3 in note four in this series and Graph 4 in note three in this series for more on how expectations for real short-term interest rates and inflation respectively are impacted by short-term factors.
[2] The concept of a ‘natural rate’ and how it impacts bond yields was covered in the fourth note in this series.
[3] Potential GDP growth shows how the economy’s output changes when it is in equilibrium and all resources are fully utilised. Growth in real potential GDP (that is, potential GDP adjusted for inflation) is influenced by growth in the labour force and in its productivity. The latter is impacted by the amount of capital per worker, the quality of labour and other factors such as how intensively inputs are being utilised.
[4] That it is possible to map easily across from real variables to a nominal bond yield reflects projections for the GDP deflator – that is, price changes across the economy which is used to move from real to nominal GDP – often being broadly consistent with bond market expectations for inflation over the long-term. For instance, at present, OECD projections for the GDP deflator in Australia over the long-term are around 2.50 per cent, slightly above market expectations for inflation over the coming 10 years (2.30 per cent). For the US, market-based expectations (~2.30 per cent) for inflation over the coming 10 years have increased in recent months to now be above projections for the GDP deflator (2.00 per cent).
[5] As a quick refresher, the first note in this series acknowledged expected short-term real interest rates as a component of bond yields. The second note pointed out how significant a component these were. The third note recognised that real policy rate expectations were the largest and most variable element of expected short-term real interest rates. The fourth note highlighted how real policy rate expectations are determined by the stance of policy expected to be needed for a central bank to achieve its monetary policy objectives. The expected stance is the difference between the real interested rate expected to be needed to meet these objectives given the cyclical state of the economy and the expected equilibrium real interest rate given structural features of the economy. While the former plays a dominant role in shaping real policy rate expectations, the latter are likely more important in determining what yields would be in equilibrium once the cyclical influences on interest rates have subsided.
[6] For the US and Australia these variables were population growth, residential lending spreads, and the cyclical stance of fiscal policy. The latter refers to the difference between the budget balance and what it would be if the economy were in equilibrium (that is, the structural budget balance). For Australia, an additional variable – the short-term component for the US – was also included. This was to account for the possibility that this measure for Australia might be impacted by developments in that for the US.
