What has driven the Australian economy’s rebalancing and what could in 2024?
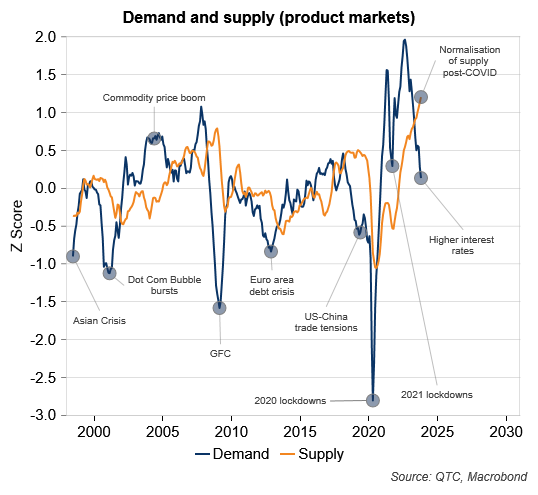
Around 18 months ago we looked at the imbalance between demand and supply in the Australian economy. At the time, product markets – that is, those for goods and services – were characterised by strong demand and constrained supply. However, in the period since, supply chain bottlenecks have eased and interest rate increases have helped slow demand. As a result, these imbalances have unwound with our latest estimates pointing to supply now being above average and rising while demand is close to its average and falling (Graph 1). This is consistent with the moderation seen in goods inflation over the past year.
Graph 1: In product markets demand has softened and has supply picked up?

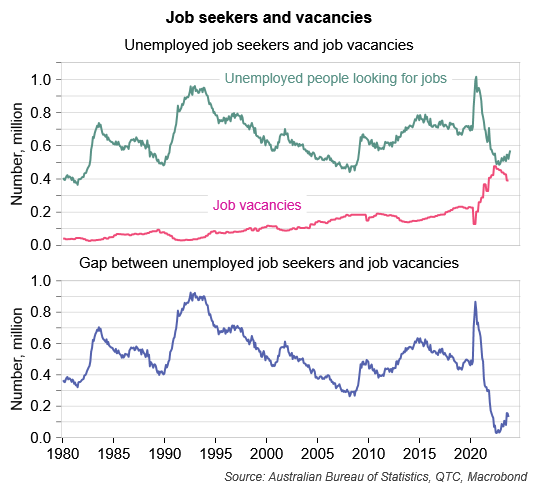
The story of rising supply and falling demand has also been evident in labour markets, though to a much smaller degree. Since around the middle of 2022 there has been an increase in the number of (unemployed) people looking for work and a decrease in the number of jobs needing to be filled (Graph 2). Nonetheless, the gap between the number of job seekers and the number of vacant roles remains at a historically low level, suggesting that labour market conditions remain very tight.
Graph 2: There was also a slight easing in the labour market, but conditions remain very tight

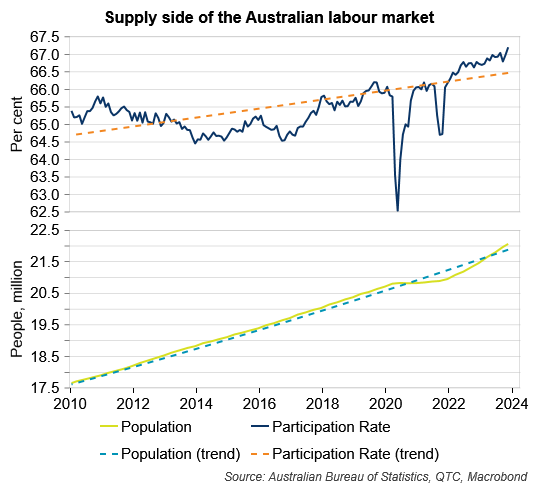
Going forward, will both demand and supply factors continue to play a role in rebalancing activity such that inflation can continue to moderate? While supply could increase further, the fact that estimates of it are at record highs in product markets and key components of it are above trend in labour markets (Graph 3), suggests that scope for this to occur may be more limited. If this is the case, then demand may have to carry more of the burden in driving economic rebalancing from here. Given this and how interest rates can impact demand, it would not be surprising if the RBA remained open to the possibility of lifting interest rates further.
Graph 3: Labour supply has increased due to higher population and participation

Can the RBA get inflation to the middle of the band by the end of its forecast horizon?
The RBA’s latest forecasts have inflation just breaching the top of its two to three percent target band by the end of its forecast period (December 2025) but not hitting the middle of the band during that period.
Under the new Statement on the Conduct of Monetary Policy (SoMP) agreed with the Government, the RBA is to work to return inflation to the middle of the target band following any deviation. There are no strict rules around how long this should take with the SoMP offering flexibility by noting that the appropriate timeframe will be contingent on the economic circumstances and should balance the trade‑off between the RBA’s inflation and full employment objectives.
Given lags in the transmission of changes in monetary policy, it is unlikely the RBA would aggressively alter settings just to hit a target within a two-year projection period. However, with an increased emphasis on returning inflation to the middle of the band, the RBA may not want the achievement of this target to be too far away either.
So, in the current circumstances, what would it take for inflation to get back to the middle of the RBA’s target band within its forecast horizon? We were able to get a sense of this by doing scenario analysis using Moody’s Analytics’ Global Macroeconomic Model.
The first scenario examined the possibility that, following the interest rate rises seen over the past couple of years, the economy turns out to be weaker than previously expected. In this scenario, the unemployment rate would rise to five per cent in the first half of 2025. This could help push inflation down to 2.4 per cent by the end of that year (which also happens to be the end of the RBA’s forecast horizon). In the second scenario, the RBA delivers three further 25 basis point rate rises to combat sticky domestic services-based inflation. In this instance the economy softens and inflation moderates, though the latter doesn’t get back to the middle of the band until mid-2026. This highlights how lags in the transmission of policy can make it difficult to hit what is now a more challenging target within the forecast horizon and is a reason for the RBA to continue to use flexibility in how it conducts monetary policy.
Further discussion and charts looking at these scenarios are available in the appendix to this note.
What is the likelihood of a US recession this year?
In mid-2022 we presented estimates suggesting that the probability of a US recession over the coming 12 months was low but that, given the size and speed of the Federal Reserve’s rate hiking cycle, might be expected to increase over time. A 2023 recession for the US had been the baseline expectation for many economists and market participants. However, as the year has unfolded, these earlier fears have increasingly given way to optimism that there will be a ‘soft landing’ given the resilience of economic activity and progress in inflation returning towards the Fed’s target. So, what are the chances of a US recession in 2024?
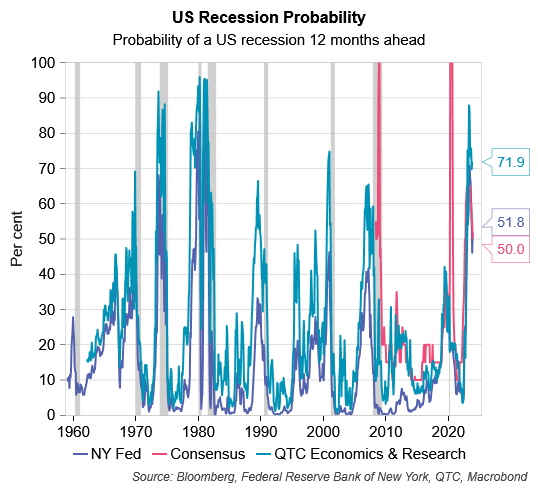
While our yield curve based models suggest a recession in the next 12 months is still more likely than not, the probability assessed of this happening has started to decline quickly of late (Graph 4). This is consistent with the message from other models and economists which earlier in 2023 had considered a recession in the 12 months ahead to be a 65 to 70 per cent probability. These now suggest it is more of a 50-50 proposition.
Graph 4: Recession probabilities for the US declined considerably in 2023

Similarly, in a qualitative sense, arguments can be made both ways as to the possibility of a US downturn (Table 1).
Table 1: Factors for and against a US recession
| Aspect | Recession – Yes | Recession – No |
|---|---|---|
| Monetary policy tightening | Real interest rates have only been positive since April 2023 and should keep rising as inflation moderates. | Soft landings are rare given size and speed or rate hike cycle but not unprecedented (for example, the mid 60s, 80s, 90s). |
| Broader measures of financial conditions | Higher bond yields have tightened financial conditions. | Despite the rise in long-term yields, refinancing activity when rates were low means that the interest rates on borrowings throughout the economy has not increased much. |
| Indicators of current activity | Unusual lags mean that indicators of current activity are yet to turn. | Indicators of current activity are consistent with below average momentum but not recession. |
| Indicators of future activity | Some leading indicators point to future conditions being below average. | Other leading indicators have stabilised recently. |
| Consumers | Savings buffers are not equal across all households. The bottom 90 per cent of the income distribution have gone through almost all the bank deposits built up during COVID. These people will likely be the marginal drivers of shifts in economic conditions. | US consumers have bult up buffers through student loan forbearance, refinancing, and home equity withdrawal. Household real disposable income to rise as inflation slows. Delinquencies on the largest type of debt (mortgage) only rising slowly and are at low levels. Large federal government deficits providing meaningful support to the economy. |
| Vulnerable segments | Commercial property, consumers and even the financial system more broadly are vulnerable to rising rates. | Better balance sheet positions (households), capital positions & government support (financial system), and more resilient economy (commercial property) could lessen impacts of higher rates |
| Recession catalysts | Economy may slow on the possible federal government shutdown or automatic spending cuts if a budget is not agreed. These open the door to the economy losing momentum which might be hard to turn around. It might also make the economy more vulnerable to an external shock. | Some of the preconditions for a hard landing (for example, imbalances in goods consumption or in the housing market, excessive leverage, or large supply shocks) are not in place. |
| Timing | The peculiarities of COVID shock affected demand and supply and have created odd timing issues which will delay, but not prevent, a recession. | The peculiarities of COVID shock affected demand and supply and have created odd timing issues which open the door to a mixed, patchy, uneven moderation in growth rather than broad based simultaneous weakness. |
Source: QTC Economics & Research
There has been a consistent moderation in recession fears over the course of 2023 in line with the surprising resilience of the US economy and meaningful progress in the return of inflation toward the Federal Reserve’s target. At this stage, a downturn – while still possible – does not appear to be much better than a 50-50 possibility.
What are the main economic and market risks (upside and downside) for 2024?
There are several risks worth considering for 2024.
For the US, relative to expectations of a ‘soft landing’, risks to economic activity appear skewed to the downside. On the fiscal side of things, a federal government shutdown looms if the current year’s budget can’t get passed. Alternatively, if government operations keep getting funded by temporary continuing resolutions and a shutdown is avoided, then provisions for automatic spending cuts could kick in as the year unfolds. There are also risks to the economy and markets related to the 2024 US election as well as the health of smaller banks and the commercial property sector in a rising interest rate environment.
For China, upside risks stem from the possibility of further policy easing as well as there being plenty of excess savings available for consumers to draw down on once confidence improves. Conversely, downside risks could become more apparent if the current period of deflation extends or if rising public debt at some point constrains policymakers’ flexibility, though it may be too soon for the latter in 2024.
For Australia, upside risks come from a potential turnaround in productivity growth as well as the scheduled Stage 3 tax cuts. Downside risks could become more apparent if sticky domestic services inflation prompts the RBA to continue to raise the cash rate.
For financial markets, unknowns exist in relation to Bank of Japan policy normalisation, developments in the US (politics as well as monetary and fiscal policy) and if (or when) higher interest rates have a more material impact.
Implications
Based on the discussion above, next year could see demand playing a larger role in the rebalancing of the Australian economy; inflation move nearer to the RBA’s target though certain scenarios may need to unfold for this to play out by the end of two year ahead forecast horizon; the US in recession, though the odds for this appear no better than 50-50 at this stage; and both upside and downside risks play out both for the economy and markets.
When at turning points in the cycle, as we are in now, visibility is limited. Therefore, the answers to these 4 questions for 2024 should be considered tentative. Greater clarity will become available as 2024 unfolds in what should be another challenging year for the global and domestic economies.
