
Bonds and bond yields
What are bonds
If money is lent in the banking system, it is done so through a loan. Money lent in public markets is done so via bonds. A bond is a debt security entitling the lender to a stream of interest payments (coupons) and the return of the loaned funds at the end of the term of the bond (its maturity). Borrowers raise the funds desired by selling bonds to lenders.
What are bond yields
Most governments access public markets to borrow. Those loaning money to governments in these markets are investors with savings they wish to earn a return on. As with any market, the items being sold have a price. As a bond is traded between investors in the market its price changes. This leads to movements in the interest rate associated with that security (that is, its yield). While this does not impact the rate paid by the borrower on funds already received, it can impact the rate to be paid on new bonds that are subsequently issued for that maturity. Therefore, the yield on a government bond can provide a snapshot of what new borrowing costs might be for the public sector in markets.
Movements in bond yields over time
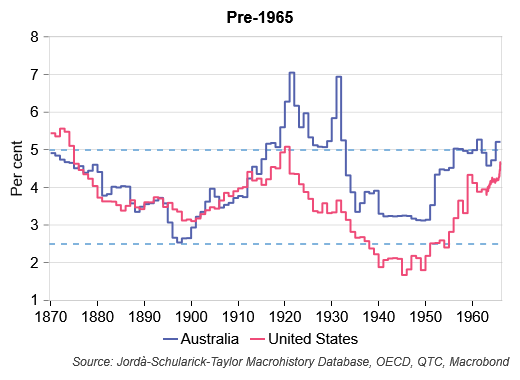
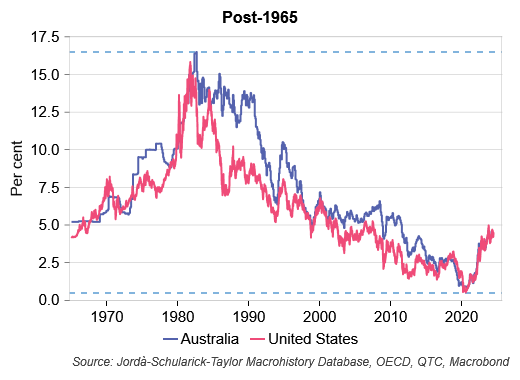
Bond yields can go for long periods without changing very much. For example, over the nearly 100 years to 1965 the yield on 10-year US and Australian Government bonds mostly traded within a 2.5 per cent to 5 per cent range (Graph 1). Equally however, there are periods where yields can change rapidly. For instance, in the roughly 60 years since, yields on these bonds have moved in a more than 15 percentage point range (Graph 2).
Graph 1 – Australian & US Government 10-year bond yields (pre-1965)
Graph 2 – Australian & US Government 10-year bond yields (post-1965)
That bond yields move by varying degrees in different periods suggest that they could be influenced by multiple factors. This makes it important to have a framework to understand what could be driving yields.
A framework to understand what is driving bond yields
The most common type of bonds are nominal bonds. These have regular interest payments which are not adjusted for inflation. Yields on these bonds reflect two components.
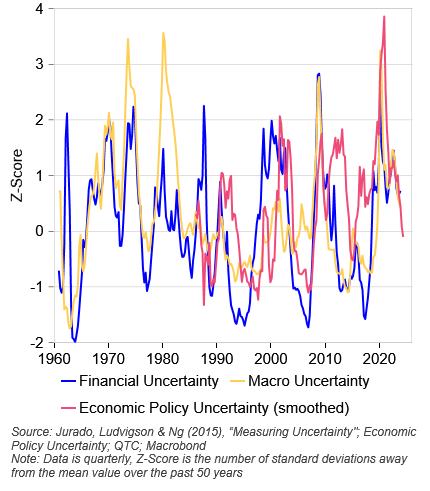
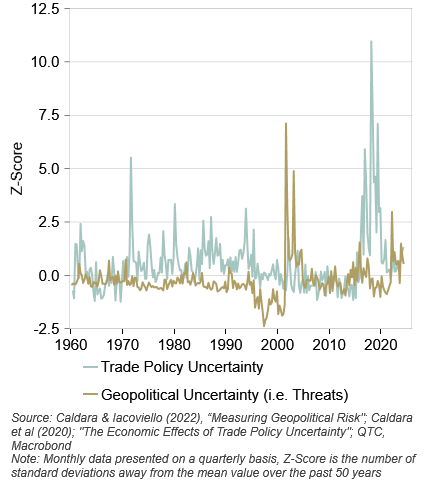
The first component is expectations for short-term real interest rates and inflation over the life of the bond (‘expectations’). Higher expected short-term real interest rates[1] or inflation[2] leads to higher bond yields (and vice versa). However, expectations frequently prove to be incorrect with the likelihood of this increasing as uncertainty about the future does (see Graphs 3 and 4 for different measures of uncertainty). Investors can choose to demand compensation to account for this risk. This is the second component of bond yields and is known as the ‘risk premium’. As uncertainty over the future rises the further we look ahead, so too does the likelihood that outcomes will differ to expectations. This means that the risk premium investors will charge to reflect this extra uncertainty will be higher for a longer-term bond than a series of shorter-term bonds. This is why the risk premium is also known as the ‘term premium’. A higher risk premium results in higher bond yields (and vice versa).
Graph 3 – US financial and economic uncertainty
Graph 4 – US international related issues uncertainty
These two components of bond yields, and their sub-components, will be briefly introduced below. The remaining notes in this series will explore each in more detail. This includes discussing estimates of these, attempting to identify what drives movements in them, providing topical examples of specific factors which could influence these and considering how these might evolve in the future.
Components of bond yields
As per Diagram 1, there are two main components to bond yields, expectations and risk premiums. For each of these components there are two sub-components, short-term real interest rates and inflation. Both the components and sub-components are positively related to bond yields. That is, when these increase, so too do bond yields (and vice versa).
Diagram 1 – What makes up nominal bond yields
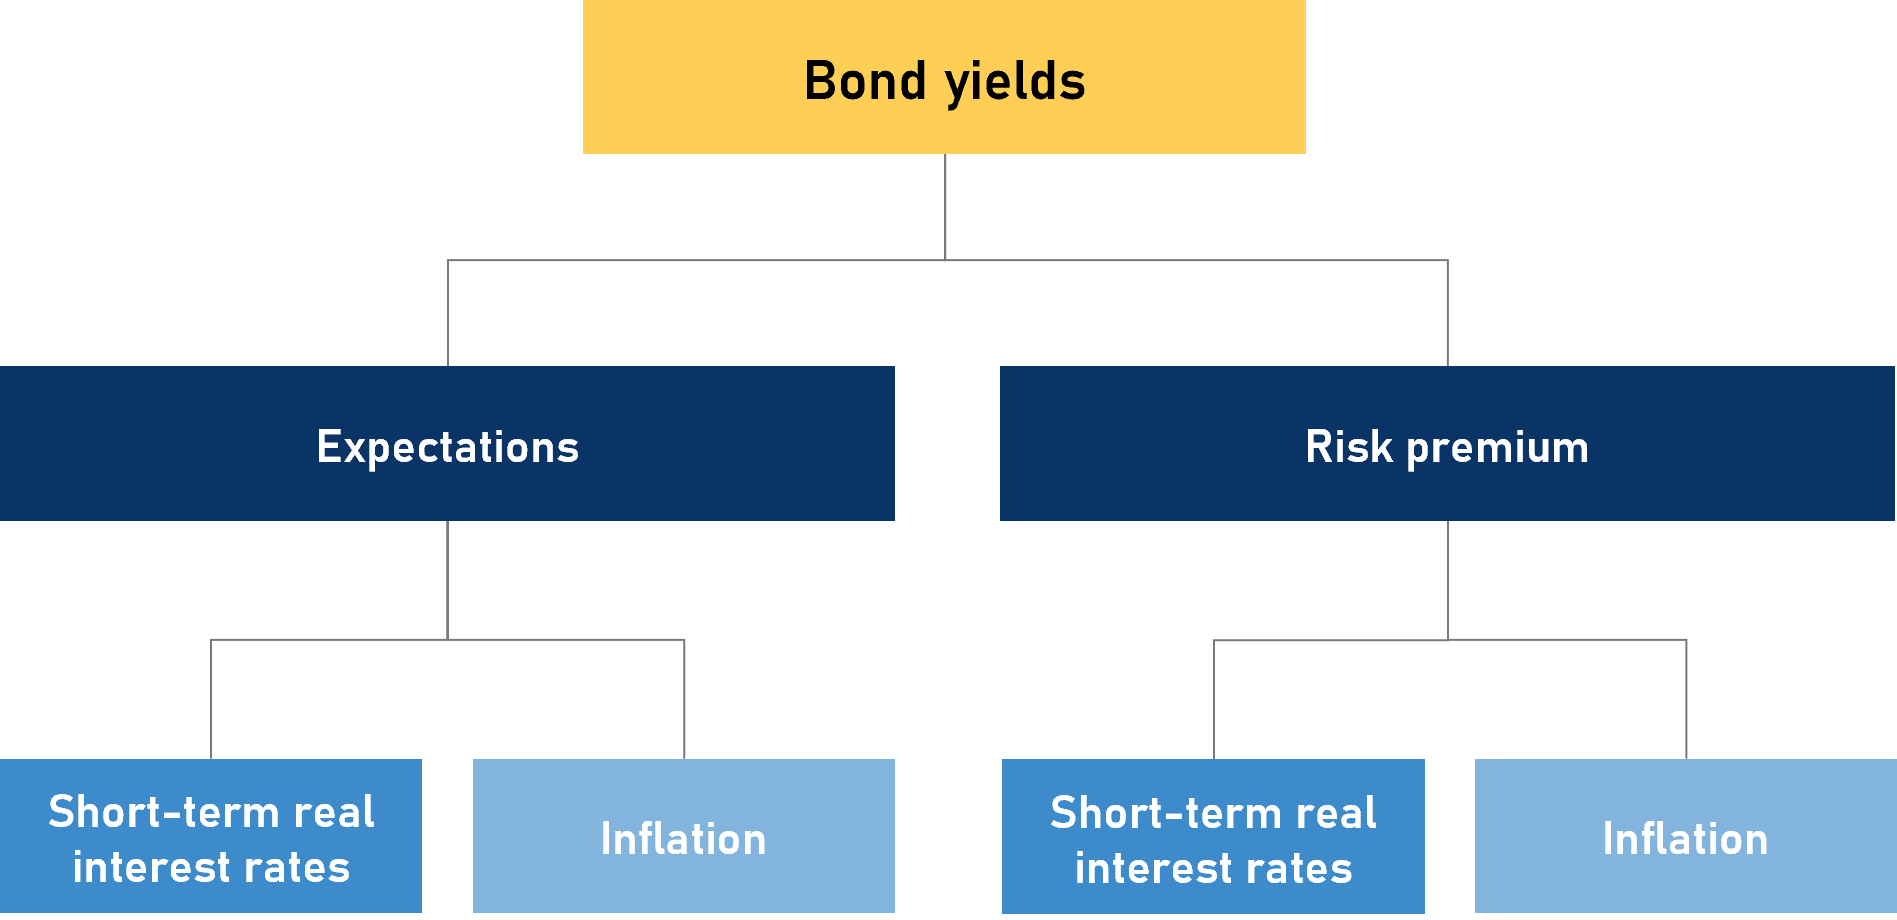
A short explanation of the sub-components of bond yields is set out below.
Expectations
- Expected real interest rates – The average expected short-term real interest rate over the life of the bond
- Expected inflation – Average inflation expected over the life of the bond
The first component is expectations for short-term real interest rates and inflation. Expectations for real interest rates are important as changes in real interest rates relative to the fixed coupon rate impact bond prices (as discussed in footnote 1). Equally, unanticipated inflation also matters as this affects the purchasing power of bond cash flows (as discussed in footnote 2).
Risk premium
- Real interest rate risk premium – If real interest rates are higher than expected, the price of the bond will be lower than anticipated. The compensation for this possibility is the real interest rates risk premium.
- Inflation risk premium – If inflation is higher than expected, then the real (that is, inflation adjusted) value of the bond’s cash flows will be less than anticipated. The inflation risk premium compensates for this possibility.
The second component is compensation for investors who, by holding a longer-term bond rather than a series of shorter-term bonds, bear the risk that outcomes for these are different to expectations.[3] This is known as the ‘risk premium’.
Estimates of bond yield components
As a preview of the next note, this section introduces high level estimates of the expectations and risk premium (or term premium) components of 10-year US and Australian Government yields.
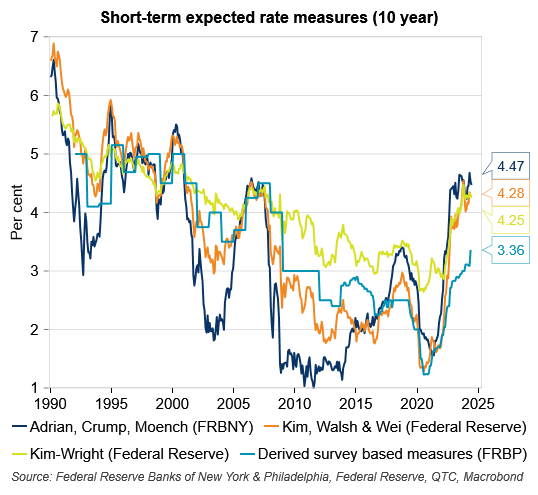
Graph 5 – Short-term expected rates (nominal) within US Government 10-year bond yields
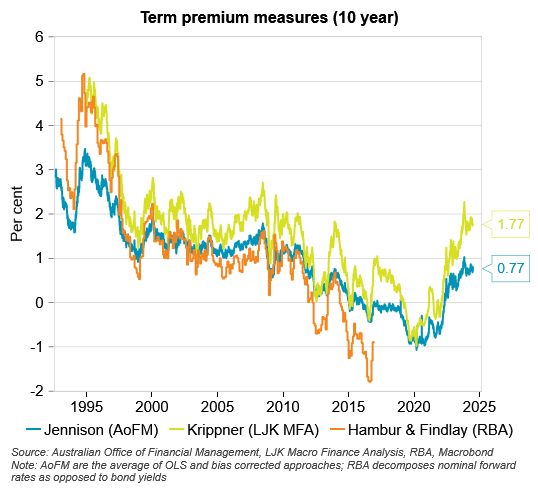
Graph 6 – Risk (term) premium within US Government 10-year bond yields
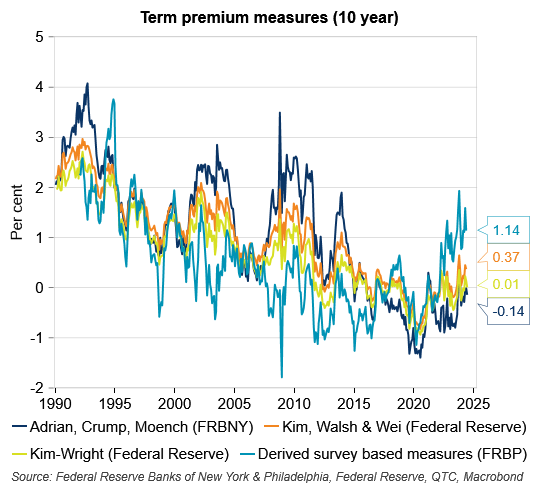
At least three observations can be made about the components of US bond yields from Graphs 3 and 4. Firstly, the expectations component larger than the risk premium component. Secondly, the risk premium component appears to be more mean reverting than trending (consistent with emerging evidence, link, link and link). Thirdly, there is a wide range of estimates for these components. This highlights the considerable uncertainty around these estimates.
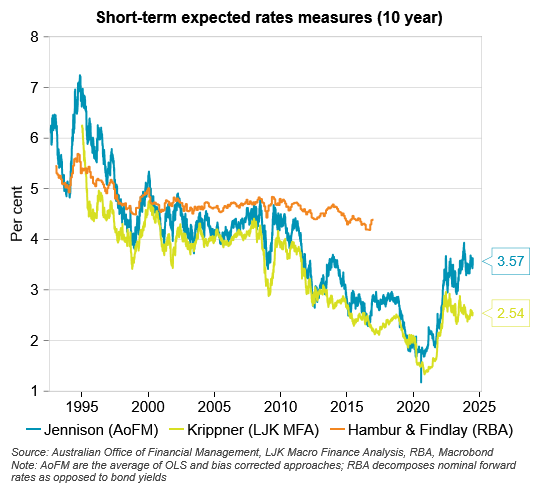
For Australia (Graphs 5 and 6), while the first observation for the US also holds here, the other two don’t seem to. That is, the risk premium seems to be more trending than mean reverting and while there is some divergence across estimates for the components, this is less pronounced than for the US.
Graph 7 – Short-term expected rates (nominal) within Australian Government 10-year bond yields
Graph 8 – Risk (term) premium within Australian Government 10-year bond yields
The usefulness of these decompositions of bond yields becomes evident when considering what has been the driver of yields over different periods of time. For instance, it is obvious from Graphs 3 to 6 that more of the rise in Australian and US Government yields since the trough in early 2020 is due to investors anticipating higher short‑term nominal interest rates (where these reflect expectations for short-term real interest rates and inflation) relative to investors demanding higher risk premiums to account for uncertainty around these expectations.
Conclusion
This piece provided a high-level overview of the components and sub-components of bond yields. It highlighted estimates of components of yields in the US and Australian contexts and noted several observations about these estimates, including on how these differed between Australia and the US. The next note in this series will examine trends in yields in more detail with a particular focus on the sub-components of bond yields.
Footnotes
[1] Short-term real interest rates are positively related to bond yields as follows. As coupon rates on newly issued bonds are often set close to prevailing market yields, higher interest rates could see the coupon rates on new bonds exceed those on existing bonds. For the existing bonds to remain attractive to investors, the price of these needs to adjust lower. The reduced price for investors to buy the bond is compensation for its lower coupon relative to those on the newer bonds. With a diminished price, the interest rate required to discount to its present value all the bond’s coupon and principal payments – such that these sum to equal the price of the bond – must increase. This is why there is an inverse relationship between the price of a bond and the interest rate on it (its yield). The yield on the bond is the interest rate which ensures that the present values of all the bond’s cash flows equal its price. Higher interest rates mean lower bond prices and higher bond yields.
[2] Secondly, for inflation. This is positively related to bond yields as follows. If inflation is higher (lower) than anticipated, then what investors can buy using the cash flows from their investment in the bond will be reduced (increased). This means that the price of the bond must adjust lower to encourage investors to buy bonds in a higher inflation environment. As per the footnote above, if a bond has a lower price, then it must have a higher yield.
[3] Investors generally want to be compensated for this risk, though at various times in the last decade or so have not needed this to be induced to hold long-term government bonds. Instead, during those uncertain times, investors were happy to forego this premium just to get a hold of what they considered to be safe investments in the circumstances.