
Estimates of bond yield sub-components
As set out in the first note in this series, there are two components to bond yields, expectations and risk premiums. The first component reflects investor expectations for short-term real interest rates and inflation over the life of the bond. The second relates to a premium that investors may seek when buying a longer-term bond rather than a series of shorter-term bonds. This is compensation for the possibility that outcomes for short-term real interest rates and inflation may differ from expectations.
For each of the expectation and risk premium components there are two sub-components, one for short-term real interest rates and one for inflation. Therefore, there are four sub-components of bond yields. These are the expectations and risk premiums for short-term real interest rates and inflation respectively.
This piece focusses on the sub-components of bond yields. Being able to get a sense of the size of these sub‑components and how these are changing is helpful in gauging what is behind changes in bond yields over time.
Sources and methods
This section sets out estimates of these sub-components for US and Australian Government bonds. It describes the approaches used to arrive at these and then discusses trends in the sub-components over time.
The estimates for the US are from Federal Reserve economists Kim, Walsh & Wei (2019) who use a ‘no-arbitrage term structure model’. Despite its complexity, this modelling technique is a standard approach for such analysis.
For Australia, Fraser Jennison from the Australian Office of Financial Management used a broadly similar approach to estimate expected rates and risk premium (Jennison, 2017). These estimates are updated regularly but do not include those for the sub-components of yields. RBA economists Jonathan Hambur and Richard Finlay estimated the sub‑components of yields, but regular updates of these are not available and the approach is challenging to replicate [Hambur & Finlay (2018)].
Given these constraints, an alternate approach is sought to estimate the sub-components of Australian yields for the purposes of providing illustrative estimates in this piece. Distinct from these more theoretical approaches, the method adopted here is more applied and involves two steps. Firstly, estimating the common trend across a range of indicators thought to proxy for the bond yield sub‑components in the Australian context.[1] Secondly, scaling these to have the same mean and standard deviation as the corresponding sub‑components from Hambur & Finlay (2018). This allows for the estimation of series which are indicative of these components to be anchored to plausible estimates of these. The results can be seen for Australian Government three-year bond yields in Graph 1.
Graph 1 – Indicators of the sub-components of Australian Commonwealth Government Bond (ACGB) yields
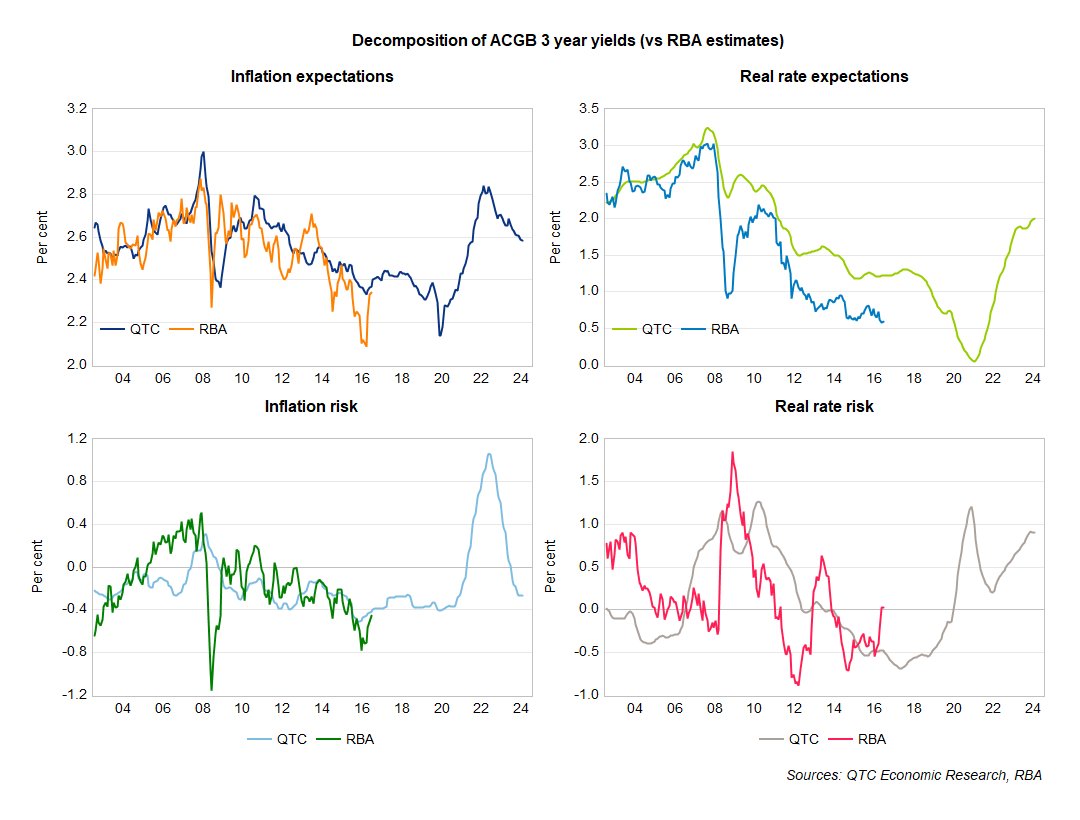
Note: The sub-component indicators won’t sum to yields exactly as these were individually scaled to the corresponding sub-component series from Hambur & Finlay (2018) over the 2003 to 2016 period as opposed to the overall level of yields over the entire period. Furthermore, the rates used in that paper were nominal forward yields which differ from the nominal bond yields used in this analysis.
The indicators of the yield sub-components show some correlation to the Hambur & Finlay (2018) estimates. However, while this correlation is not perfect, having these indicators still provides valuable information. They serve as useful directional guides, allowing us to gauge the likely movement of sub-components even in the absence of other regularly updated Australian estimates. However, given that recent readings can’t be benchmarked to alternate estimates, makes it appropriate to focus on US yields for the more detailed discussion that is to follow in this note on the trends in and drivers of changes in the yield sub-components.
Historical trends in bond yield components
This section looks at which sub-components have contributed to changes in bond yields during three distinct periods:
- the pre-GFC multi-decade decline in yields,
- the post-GFC/pre-COVID period of low yields, and
- the post-COVID period of rising yields.
Pre-GFC multi-decade decline in yields
Bond yields fell considerably between the early 1980s and the GFC.
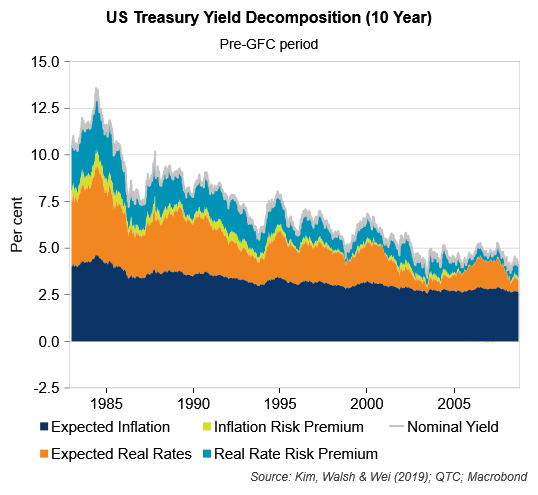
In the US (Graph 2), 10-year Treasury yields fell by 6.4 percentage points (or 640 basis points) between the start of 1983 and August 2008 (prior to the start of the GFC) [Kim, Walsh & Wei (2019)].
Of this decline, 445 basis points – or more than two ‑thirds – was due to a drop in the real interest rates, including both the expected real rates (~-220 basis points) and the risk premium on real rates (~-225 basis points) sub-components. Lower expected real interest rates during this period would likely be due to central banks having success in reducing inflation and thus being able to reduce policy rates. With inflation seemingly contained, real interest rates were anticipated to be lower in the future and increasing conviction in this view over time meant that investors didn’t feel it necessary to demand as much of a premium for the possibility that real interest rates would rise sharply.
The remainder of the decline in yields during this period (-200 basis points) was due to lower inflation, including reduced expectations of future inflation (-130 basis points) and the risk premium sought to reflect uncertainties around the inflation outlook (-70 basis points).
Graph 2 – Real interest rates declined substantially in the 25 years before the GFC
Post-GFC to pre-COVID period of low yields
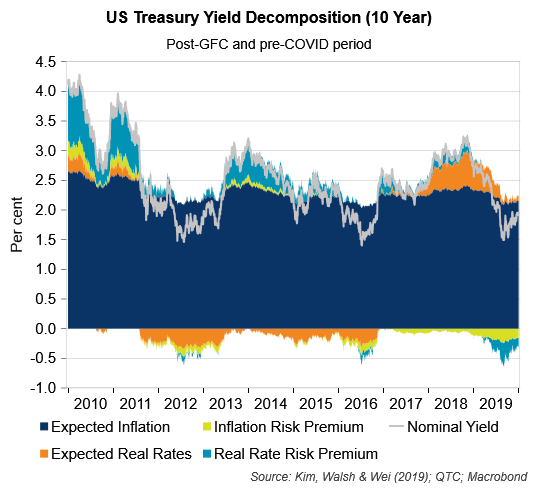
While the couple of decades prior to the GFC were characterised by a substantial decline in yields, the dip in 10-year US Treasury bond yields in the post-GFC but pre-COVID period of 2010 to 2019 was far smaller at ~225 basis points. However, and as per Graph 3, this does not mean there were not interesting observations that could be made from this period. For example, expected real interest rates were negative at points during this time as were risk premiums related to both real interest rates and inflation. These outcomes had never before been observed in the history of these estimates.
The biggest driver of yields over this period was the decline in the risk premium related to real interest rates (~‑115 basis points). Given the low growth and inflation at the time, the Federal Reserve actively used interest rate and balance sheet policies to try to boost economic activity and inflation. However, the legacy effects of the GFC made the recovery following it a sluggish one. This gave investors comfort that interest rates weren’t going to shoot higher and, as a result, that the compensation needed to account for this risk could be lower. This backdrop of low inflation and accommodative policy settings was also consistent with the change over the period in expected real interest rates (~‑20 basis points), expected inflation (~-50 basis points) and the risk premium related to inflation (~‑40 basis points).
Graph 3 – Risk premiums were negative at various points in the post-GFC and pre-COVID period
Post-COVID period of rising yields
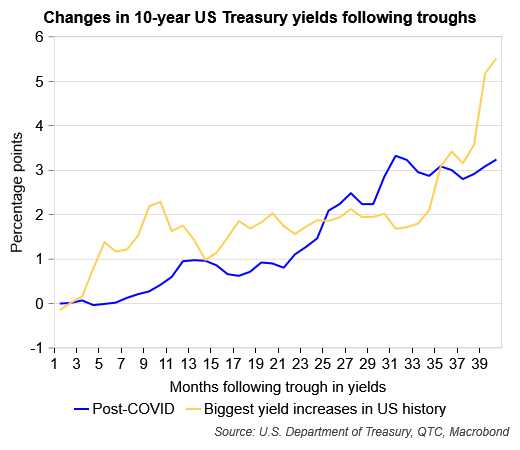
The increase in 10-year US Treasury yields between April 2020 and October 2023 is comparable to movements in yields over this sort of time horizon (roughly 40 months) across the biggest periods of bond selling in US history (Graph 4).
Graph 4 – US Treasury yields have increased substantially since troughing during COVID
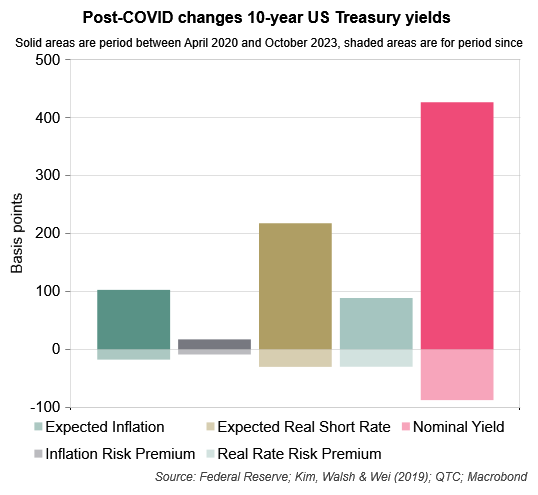
As per Graph 5, this rise in yields (~+425 basis points) was driven by higher expectations for inflation (~+100 basis points), and in response to this, for expected real short-term interest rates (~+215 basis points). Premiums sought by bond investors for interest rate and inflation risk also rose but by smaller amounts (~+90 basis points and ~+20 basis points respectively). More recently, with inflation on its way back towards the Federal Reserve’s target, expectations for this and future interest rates have moderated and put downwards pressure on bond yields. Greater confidence in this view has seen the premiums required to compensate for risks around this central expectation decline also.
Graph 5 – Expectations for real short-term rates and inflation have driven yields higher in recent years
While these estimates are useful in determining which of these sub-components are driving changes in bond yields, they do not offer guidance on what might be behind the movement in the sub-components. This is what the next note in this series will aim to cover.
Conclusion
This note builds upon the first in the series, which provided a high-level overview of the components and sub‑components of bond yields. It focused on estimates of the sub-components of both Australian and US government bond yields.
Indicative estimates for Australia were presented with the aim of gaining at least a sense of direction as to how these sub-components might be evolving. The estimates show that for three-year Australian Government bond yields and since the RBA started increasing interest rates in mid-2022, the expectations and risk premiums of sub-components have declined in relation to inflation but risen in terms of real interest rates.
With the Australian context presenting challenges in estimating and benchmarking these sub‑components, the discussion in this note primarily centred around US Treasury bond yields. In doing so, this piece discussed trends in the sub‑components of yields during three distinct periods: the pre-GFC multi-decade decline in yields; the time between the GFC but before COVID-19; and the post-COVID period of rising yields.
The next note in this series will try to identify what factors could influence the changes in these bond yield sub‑components overtime.
Footnotes
[1] The series included in this analysis are described in the Technical Appendix to this note.