
Looking under the hood of short-term expected real interest rates
As a reminder, there are four sub-components of bond yields that sit within two broad groupings. Firstly, expectations for real interest rates and inflation. Secondly, premiums that investors may demand to account for the risk that actual real interest rates and inflation might differ from these expectations if a longer-term bond were to be bought instead of a series of shorter-term securities.
Expectations for short-term real interest rates are one of the largest sub-components of bond yields. The third note in the series found that, unsurprisingly, real policy rate expectations were the biggest (and most volatile) component of expected short-term real interest rates. Diagram 1 maps out how the two are related and what might drive movements in the latter. Gaining insights into what is driving real policy rate expectations could be helpful in developing a deeper understanding of what is behind movements in overall bond yields.
Diagram 1 – What makes up expected short-term real interest rates
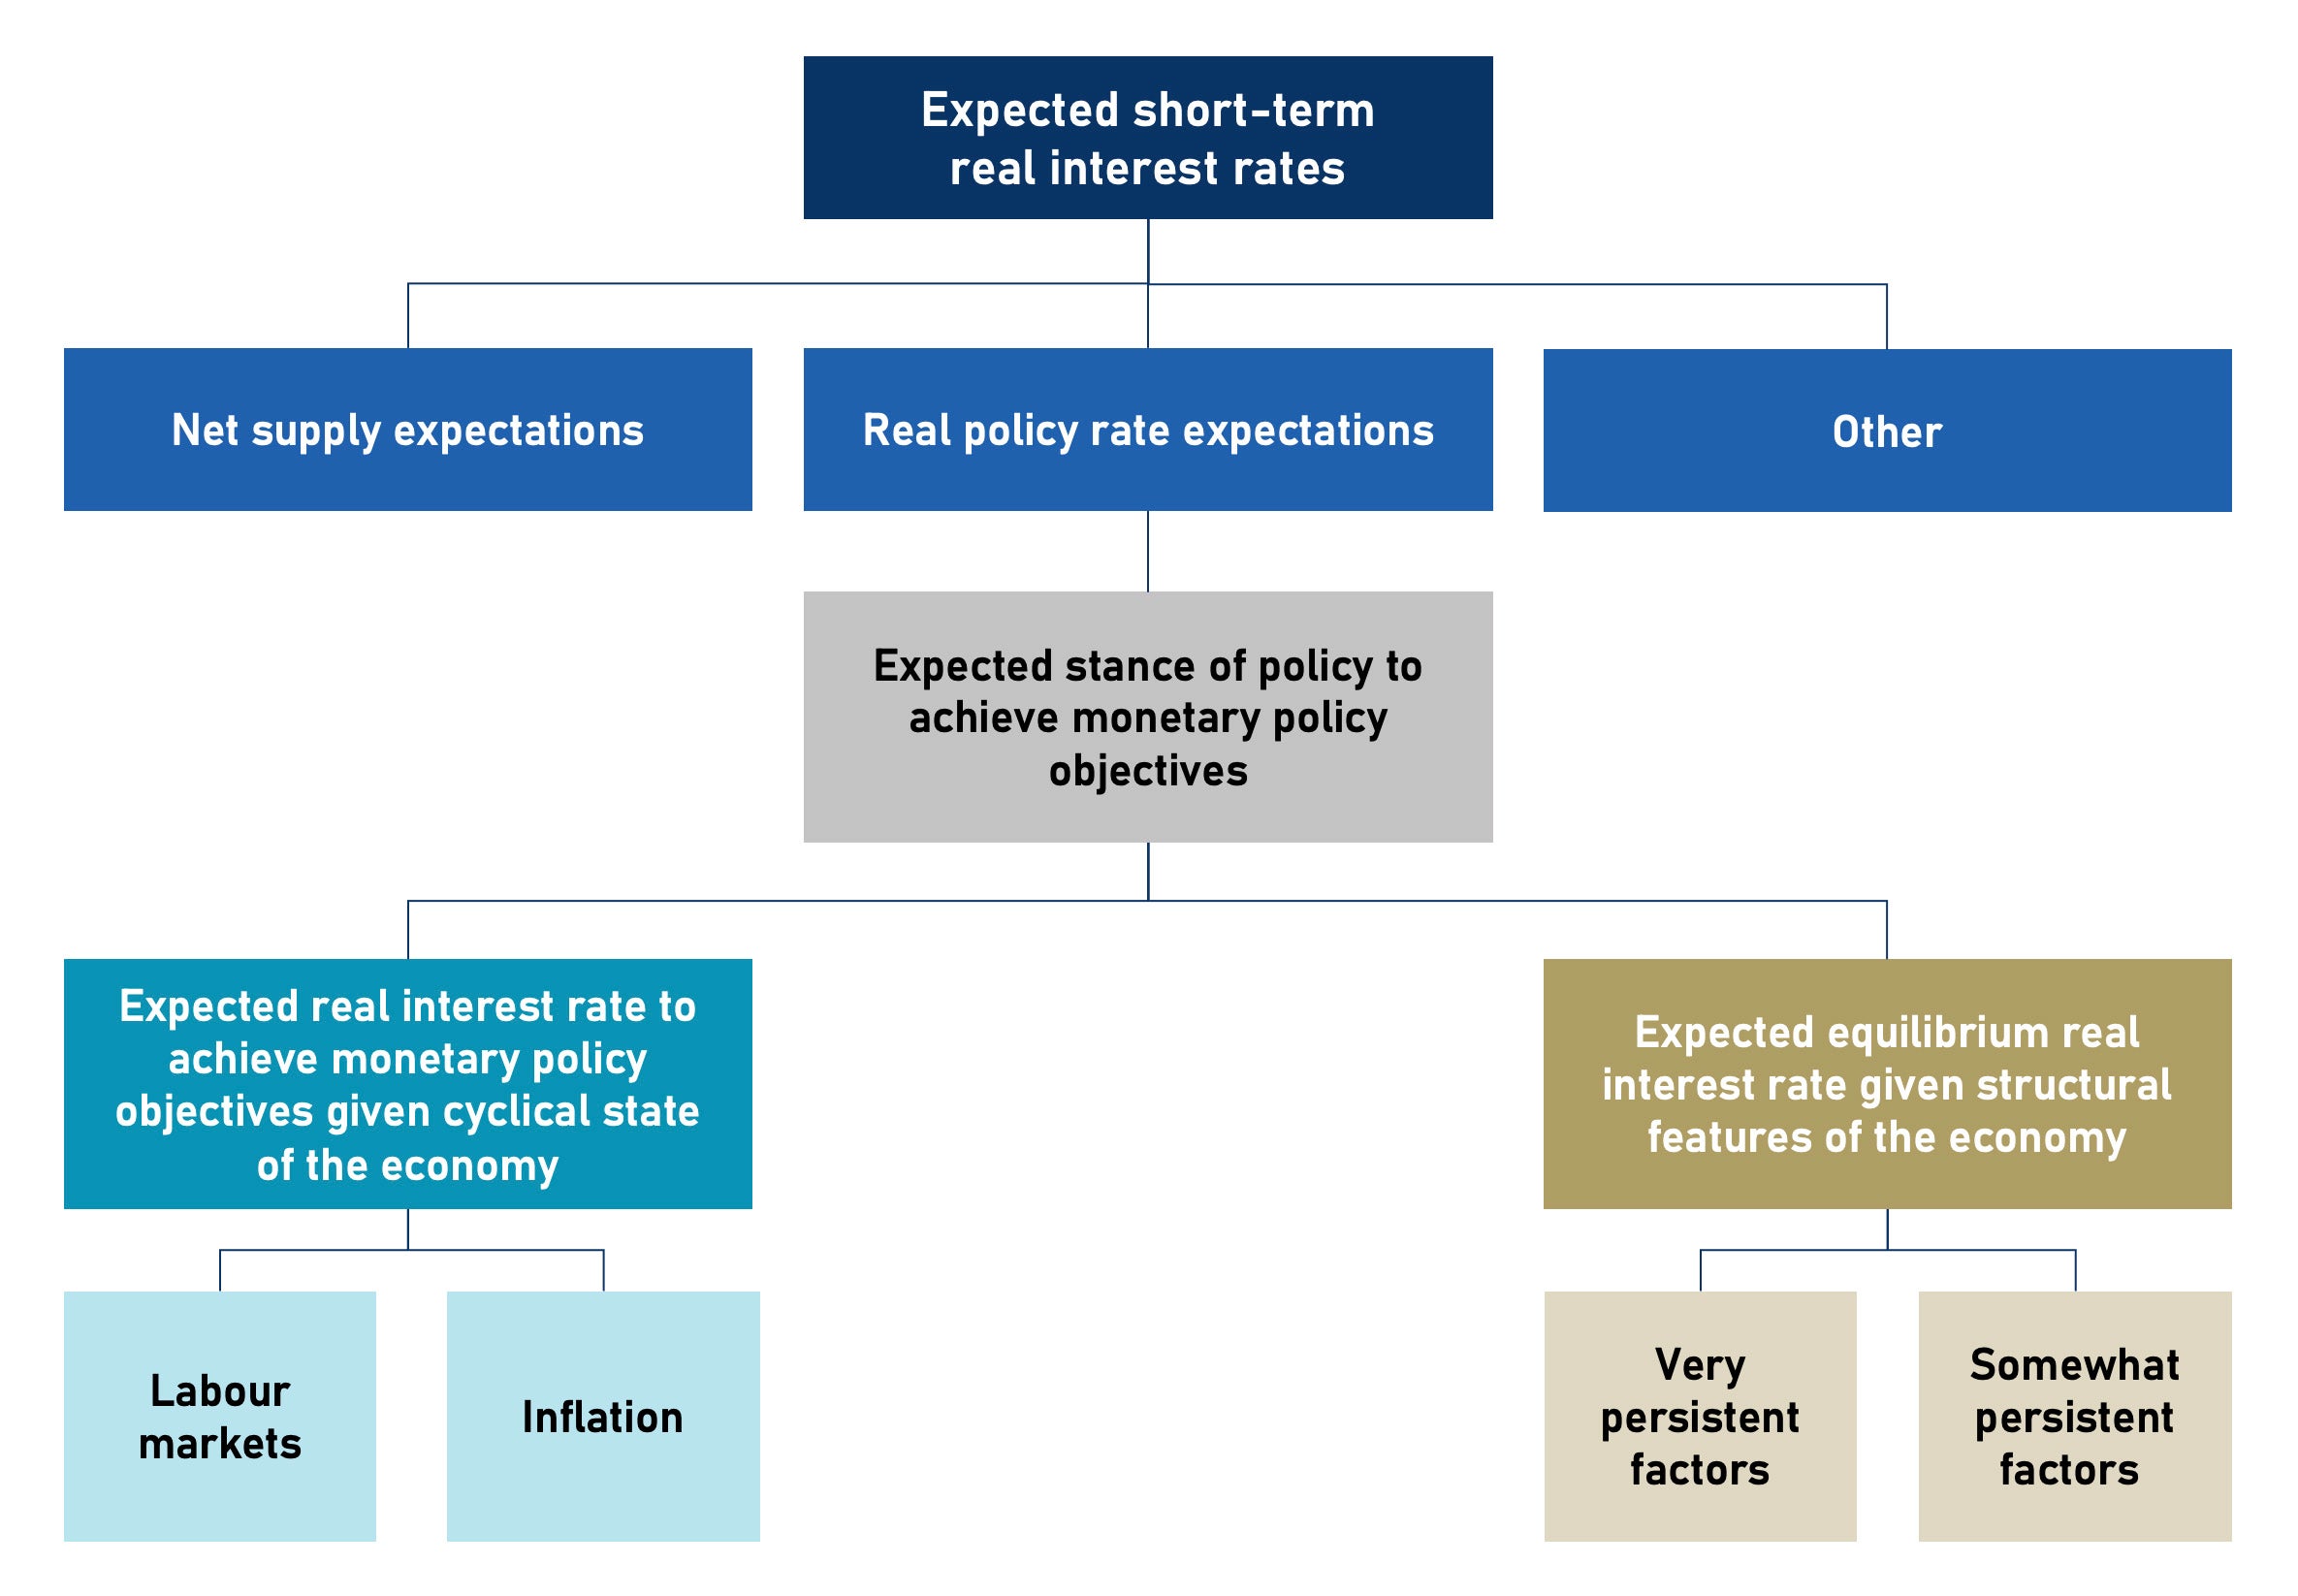
Diagram 1 suggests that real policy rate expectations are shaped by views around a central bank’s expected policy stance. This stance is calculated by taking the difference between expectations for two interest rates.
The first is the short-term real interest rate expected to be set for the purpose of closing the gap between current economic conditions and those which would occur if the central bank were successful in meeting its objectives. The second is the short‑term real interest rate which is expected to prevail in equilibrium once these objectives have been met. The first rate is influenced by the cyclical state of the economy while the second is impacted by structural features of the economy.
The extent to which these structural features impact the real short-term interest rate that might be expected to exist when the economy is in equilibrium will differ depending on their nature. For example, those related to trends in the labour force and productivity can be very persistent. Meanwhile, others – such as spikes in population, government spending or uncertainty – may be less so. It is possible for the economy to be in equilibrium over various time horizons and for the factors impacting expected real short-term interest rates across these to be different. This suggests that there may be more than one concept of equilibrium interest rates.
Economists frequently discuss the factors that could influence equilibrium interest rates, although rarely offer guidance as to the time horizon over which this impact might be felt or seek to examine how these might influence the most relevant sub-components of bond yields. This is the focus of this piece. It is topical given the public interest in where rates may settle over the longer-term following the post-COVID-19 rise in yields. It is important as developments over these extended horizons mostly take their cue from the structural features of the economy.
Neutral vs Natural rates
Economists often use the terms ‘neutral rates’ and ‘natural rates’ interchangeably. This implies a single concept of an equilibrium interest rate. However, given the range of factors which can influence equilibrium rates and the varying time horizons over which these may do so, it is not unreasonable to think of these as being two separate concepts.
This is the approach taken by Obstfeld (2023), who distinguishes between these two rates based on time horizon. The natural rate is the one which establishes equilibrium for the economy in the long run when there are no rigidities impacting how prices adjust. In contrast, the neutral rate is that which – over the time horizon relevant for monetary policymakers – ensures that full employment is achieved and inflation is consistent with target. Both rates are those which would exist when the economy is in equilibrium, except that each relates to a different time horizon.
The Bank of England (see Box 6 of this 2018 report) provides additional clarity around this distinction by suggesting that the equilibrium real interest rate (the ‘neutral rate’ in Obstfeld’s terminology) is the sum of a longer-term rate (the ‘natural rate’ in Obstfeld’s terminology) and a shorter-term component.
Equation 1 – Breakdown of equilibrium real short-term interest rates
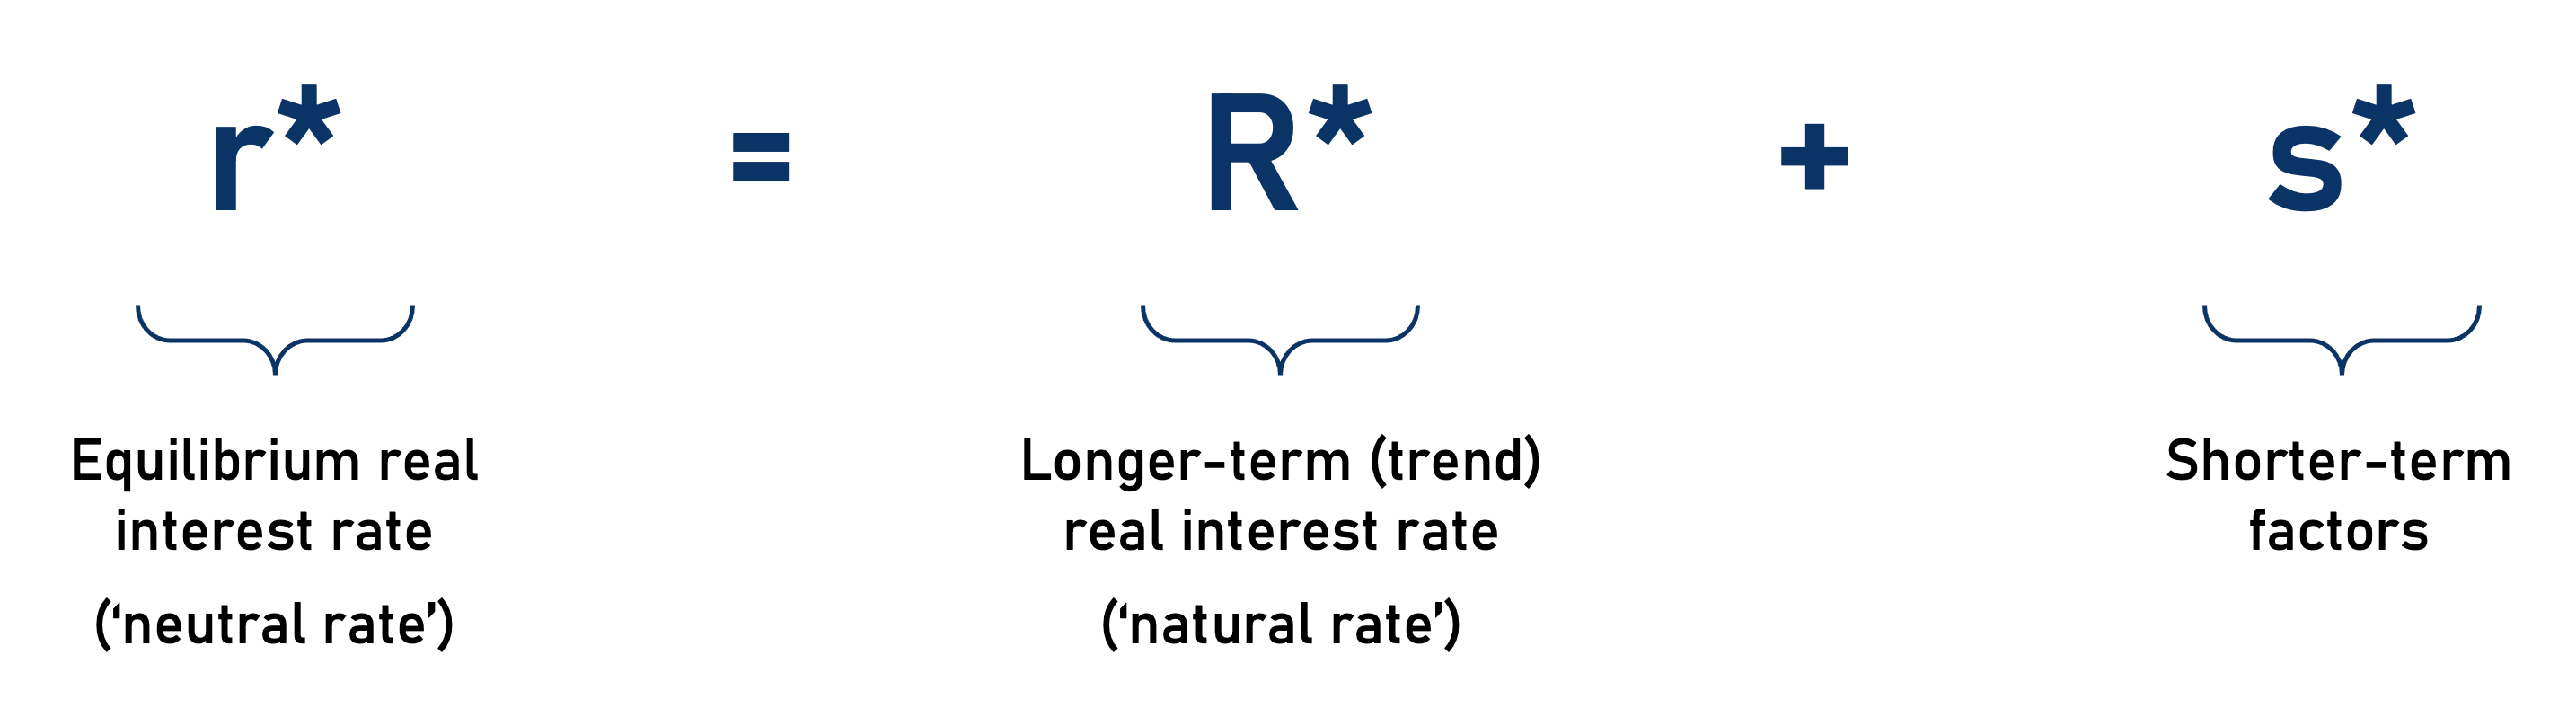
Of the elements in Equation 1, the first is the interest rate which prevails when the economy is in equilibrium as characterised by full employment and inflation consistent with target. At this point monetary policy is neither restrictive nor accommodating, it is neutral (which is why it’s called the ‘neutral rate’).
The second element is the longer-term rate (‘the natural rate’). This is the rate which ensures that the market for loanable funds – that is, where the supply of savings is matched against demand for those savings to fund investment – is in equilibrium. The longer-term rate is impacted by factors which have very persistent impacts on the supply of savings and demand for investment. These can have a gradual but more persistent impact on the neutral rate.
The third element is for factors which have a more temporary impact on the neutral rate.
The distinction between these concepts and examples of what factors may influence these rates is set out in Table 1.
Table 1 – Distinguishing between different types of equilibrium interest rates
| Type of rate | Time horizon | Examples of factors that can impact |
| Equilibrium real interest rate
(‘neutral rate’) |
Medium-term | Those that influence both the shorter and longer-term components. |
| Longer-term component
(‘natural rate’) |
Longer-term | Factors impacting saving and investment such as demographics, technical advancement and uncertainty. |
| Addendum
Shorter-term component |
Short-term | Shocks to population, fiscal settings, inflation expectations and terms of trade.
Uncertainty affecting the availability or cost of credit and/or the ability or willingness for households to consume or businesses to invest. Structural shifts in portfolio flows or asset prices that impact the exchange rate and wealth respectively. |
Source: Obstfeld (2023), Box 6 of Bank of England (2018), various studies, author
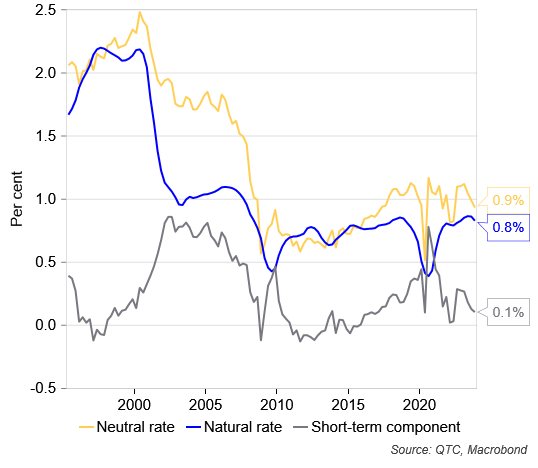
The distinction between the neutral and natural rate concepts of equilibrium real short-term interest rates can be seen in Graphs 1 and 2 below. These show estimates for the US and Australia respectively.[1]
Graph 1 – United States – Equilibrium short-term real interest rates
Graph 2 – Australia – Equilibrium short-term real interest rates
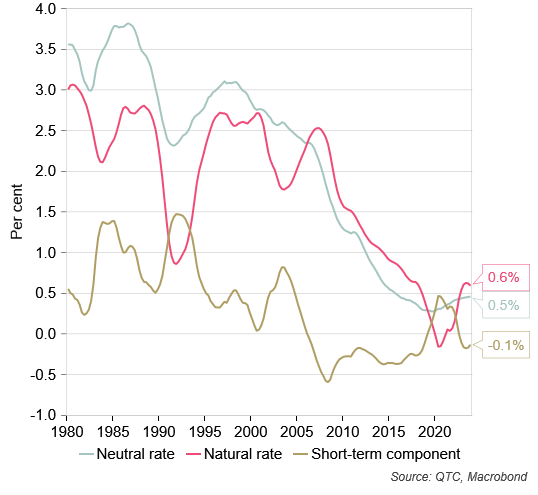
As these cannot be directly observed, large uncertainty exists around estimates of neutral and natural rates such as those depicted in Graphs 1 and 2. That said, several broad trends in these series are worth highlighting.
In the US, the neutral rate fell in the years prior to the GFC (which took place between mid-2007 and early 2009), dragged down by declines in the natural rate. This decline was likely due to unfavourable long-run trends such as a slowing population and productivity growth. The decline in the natural rate didn’t flow through fully to the neutral rate as it was held up by transitory factors over this period. In the decade or so following the GFC, the neutral rate increased consistent with movements higher in its longer and shorter‑term components. This came to an end during COVID-19 where the neutral rate exhibited some volatility, driven by large shifts in transitory factors including pandemic era fiscal support and a tightening of financial conditions as a result of stressed market conditions. Following the pandemic, the neutral rate has been broadly stable as the increase in the natural rate has been largely offset by a decrease in the short-term component. It is hard to say what might be behind the rise in the natural rate, but possible explanations include lower levels of private debt and economic policy uncertainty (with both reducing the need to save more) as well as higher levels of capital accumulation and efficiency (with both raising investment). Some of the demand for investment may be due to government incentives offered to increase investment in clean energy technologies and to improve self-sufficiency in semi-conductor production.
In Australia, there were steep declines in the natural rate around the time of the recessions in the early 1980s and early 1990s. A slowdown in trend growth in the productivity of labour and capital may have played a role in this by pushing the natural rate lower.[2] A tightening of financial conditions around these times (as captured by a rise in the short-term component) appears to have prevented the neutral rate from declining by more than it did. Following these periods, both the neutral and natural rates declined consistently until COVID-19, after which they increased. Like in the US, higher temporary levels of government spending could have pushed the short-term component higher during the pandemic. Since then, higher potential GDP growth – perhaps due to stronger population growth as well as higher levels of capital accumulation and efficiency, may have pushed the natural rate higher. With the neutral rate not declining, this implies that the shorter-term component has played less of a role.
How equilibrium interest rates flow through to bond yields
As a reminder, real policy rate expectations are estimated to be the largest driver of expected short-term real interest rates which, in turn, is one of the biggest components of bond yields. Using the US as an example (given the findings in part 3 of this series) and based on the aspects of real policy rate expectations as per Diagram 1, Graph 3 breaks down this very important driver of bond yields.
Graph 3 – US – Breakdown of real policy rate expectations
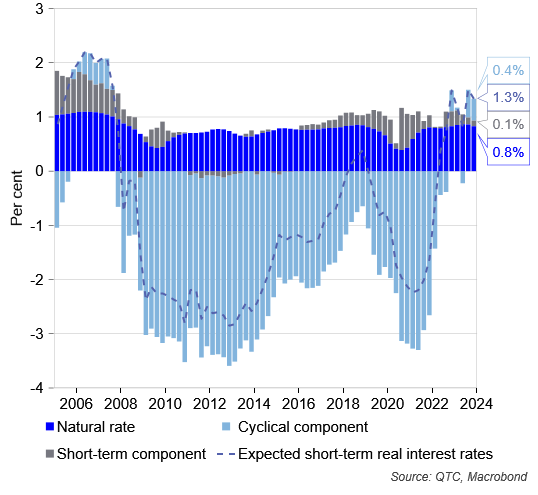
This points to the important role that structural factors can play in influencing real policy rate expectations. This could be due to factors that are either very persistent (and impact the natural rate) or less persistent (and affect the short‑term component). Together these add to the neutral rate and highlight why this is an important factor when considering shifts in bond yields. That said, Graph 3 also highlights that cyclical factors may have an even bigger impact on real policy rate expectations (and thus, bond yields). Specifically, it is expectations for the real interest rates required to achieve monetary policy objectives given the state of the economy that appear the most important driver.
Conclusion
This piece is the fourth in a series on bond yields. The first provided a high-level overview of the components and sub‑components that make up yields, the second looked at estimates of and trends in the sub-components, the third examined what factors might be behind moves in these sub-components. This fourth note analysed equilibrium interest rates, a topical factor thought to drive expected short-term real interest rates, one of the components of bond yields.
The piece drew a distinction between different concepts of equilibrium interest rates, presented estimates for each, highlighted how the different concepts of equilibrium interest rates could potentially impact bond yields, and presented a qualitative analysis of what has driven each in recent decades.
The next note in this series will be another deep dive into a topical factor which could influence a different sub‑component of bond yields, the risk (or ‘term’) premium related to real interest rates. That topical factor is the US Government’s fiscal trajectory.
Footnotes
[1] The neutral rate for the US was taken as the average of various estimates available from the Federal Reserve Banks of New York and Richmond as well as Leo Krippner Macro Finance Analysis. That for Australia came from estimates by my colleague Trent Saunders for the pre-COVID period (link) with judgement used thereafter. The natural rates for both countries were taken as the common trend across different series thought to influence the level of savings and investment. These include how intensely capital is used throughout the economy, how efficient additional investments in capital are, labour productivity, labour’s share of total income in the economy, labour costs relative to those related to capital investment, potential output and employment, as well as geopolitical risk and uncertainty around economic policies.
[2] It is important to distinguish between the short and long-term when considering how productivity can influence interest rates. In the short run, a slowdown in productivity growth means a given rate of wages growth will be more inflationary and thus require higher actual interest rates. In contrast, in the long run, a slowdown in productivity growth will imply lower returns which should prompt less investment and lead to a lower neutral rate.