US fiscal trends
Prior to 1960, US policymakers aimed to run balanced budgets except under extreme circumstances such as wars, pandemics, or financial crises (Graph 1). However, there was a change in philosophy in the 1960s under Lyndon B. Johnson away from balancing the budget towards using fiscal policy to achieve economic and social objectives.[1] This was a material change and the first modern example of a President running budget deficits to pursue signature economic strategies. Subsequent examples include ‘Reganomics’, ‘Trumponomics’ and ‘Bidenomics’. This shift has led to a persistent deterioration in US fiscal metrics. For instance, over the roughly 75-year period between the start of the 1960s and the end of the projection period in 10 years’ time, the US is expected to have only run six budget surpluses with an average deficit of three per cent of GDP over this time.
Graph 1 – The US mostly runs deficits which are…

Budget deficits have been run consistently for decades. This suggests that it is structural more so than cyclical factors which have driven fiscal performance (Graph 2).
Graph 2 – …largely independent of economic conditions…

Note: ‘Structural fiscal drivers’ is the IMF’s estimate of the structural budget balance (that is, what the budget position would be if the impact of economic conditions on the budget was removed). ‘Cyclical fiscal drivers’ represents the difference between the budget balance (which includes the impact of economic conditions) and the structural budget balance (which does not).
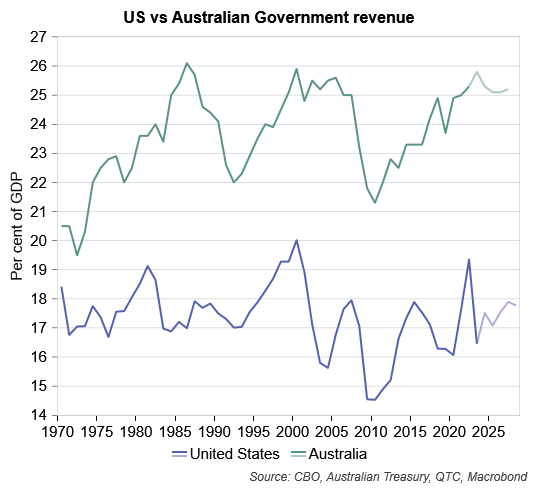
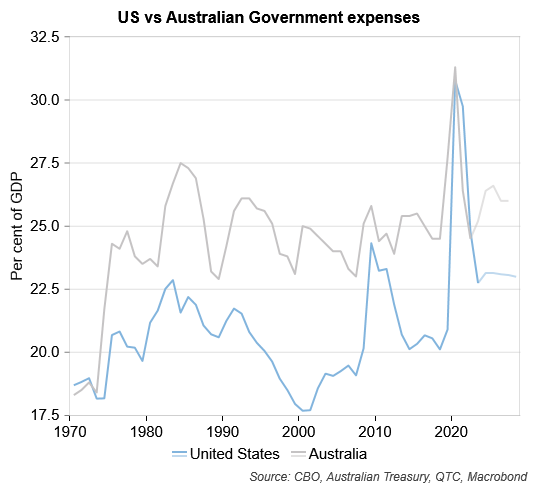
The drivers of this weak fiscal performance have been on both sides of the budget. On revenue, tax cuts and tax breaks have prevented the US revenue base from growing as a share of the economy like it has in other countries (Graph 3). On expenses, the level of spending compares favourably to peer economies (Graph 4). However, it is the trajectory of spending in the post-2000 period that has raised concerns. If revenue continues to trend sideways as a share of the economy, and expenses move higher, then fiscal challenges will continue to build.
Graph 3 – …and reflective of the US not allowing its revenue base to expand…
Graph 4 – …whilst allowing that to occur on the expenditure side
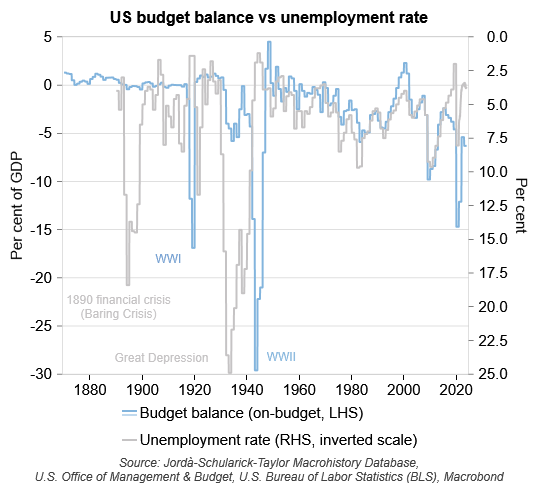
Fiscal slippage has also become more apparent over the Biden and Trump Administrations (Graph 5) when an historically wide gap between the state of the economy (as measured by the unemployment rate) and that of public finances (as measured by the budget balance) has opened up. Large deviations have occurred previously, though this was mostly in earlier periods when there were war efforts to be funded or there were financial crises, but fiscal policy wasn’t used as a tool to stabilise the economy. However, in the post-WWII period there has been a close correlation between the state of the economy and condition of federal finances. The current divergence between the two is historically unusual with budget weakness hard to reconcile with resilient economic conditions.
Graph 5 – This time is different
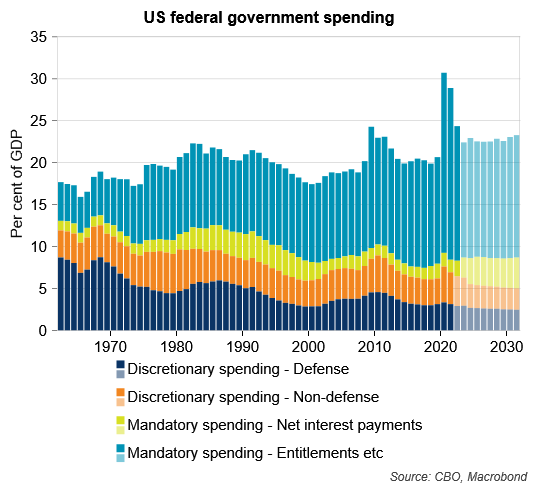
That the US budget deficit is so significant in good economic times raises the question of how large it could get if the economy entered a downturn. That said, it is not necessarily the case that US fiscal trends reflect cyclical conditions only. Indeed, as mentioned earlier, it is the consistent mismatch between revenues and spending which have persisted across economic cycles that have produced ongoing deficits. There is no sign of this ending soon given that ‘mandatory spending’ (for example, on entitlements and interest payments) is set to drive government spending higher over the coming decade (Graph 6). This has raised concerns amongst rating agencies and investors about the US fiscal outlook. This is examined in the next section.
Graph 6 – Non-negotiable items are set to lift spending higher
US fiscal outlook
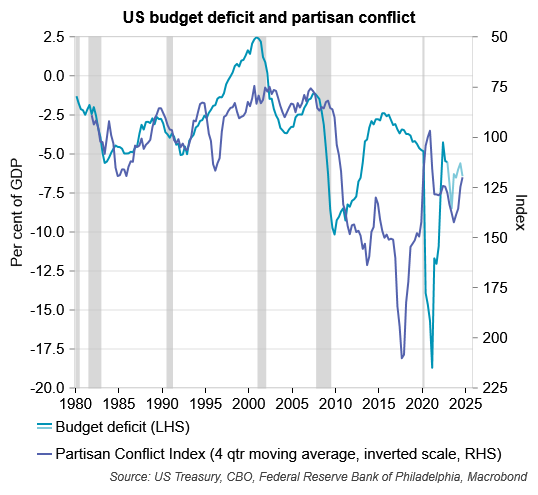
The US’ fiscal challenges are entrenched and given how polarised politics is there (Graph 7), there appears little prospect that these trends will meaningfully change anytime soon, as absent policymakers’ hands being forced by the market.
Graph 7 – A divide amongst policymakers could make fiscal repair challenging
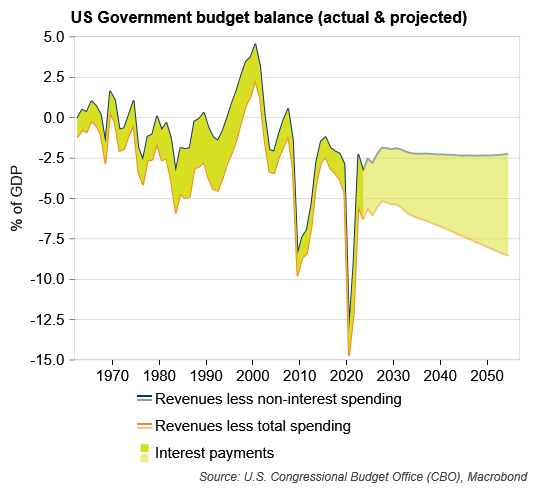
To avoid this, US policymakers at some point will need to take steps to consolidate the country’s finances. Failure to do so could see accumulated debt and rising interest rates open the door to unstable debt dynamics. In this scenario, high debt leads to rising bond yields which lead to bigger budget deficits and more debt. To illustrate this, and assuming no changes in policy settings, the budget deficit is set to increase from 6.3 per cent of GDP last year to 8.4 per cent of GDP in 30 years’ time. Over this period, the budget balance excluding interest payments (known as the ‘primary balance’) is expected to improve by one percentage point of GDP. Though, it is anticipated that this will be offset by a 3.2 percentage point of GDP lift in net interest payments (Graph 8).
Graph 8 – Interest payments to drive deficits higher…
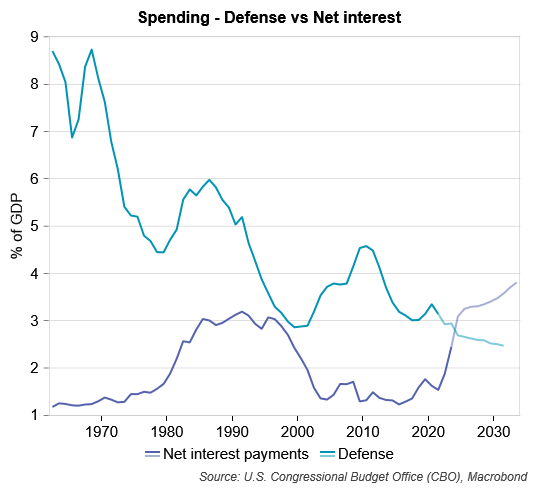
Indeed, net interest payments are expected to exceed spending on defence for the first time on record this year (Graph 9). This means that the US will be the world’s biggest spender on defence and on interest on sovereign debt.
Graph 9 – Net interest payments set to exceed defence spending for the first time
Absent policymakers taking steps[2] to reverse this trajectory or investors in US Government bonds selling out of these securities which may force their hands, US Government debt could converge to an ever-increasing path to be 163 per cent of GDP by 2053 (Graph 10) and 566 per cent of GDP by 2097 (see page 15 of this report).
Graph 10 – Debt to soar if no action taken
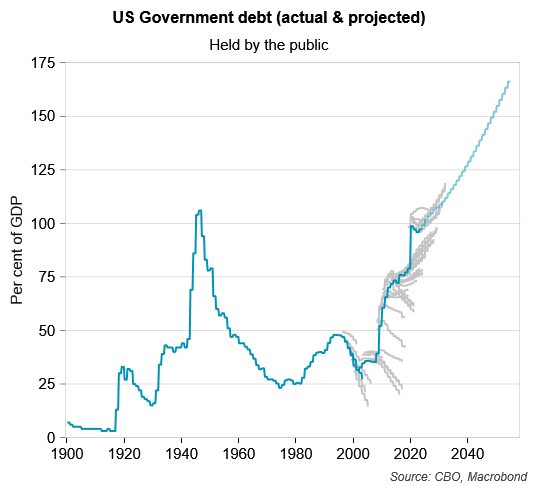
Note: Grey lines represent Congressional Budget Office (CBO) projections made at different points in time in its 10-year budget projections
While these projections are conservative in that they assume no economic downturns and only modest increases in the average interest rate on US Treasury debt over this time, they may also be unrealistic in that they assume policymakers may choose not to try to contain rising debt or that, failing this, financial markets don’t force them to. The potential impact of rising borrowing requirements on the cost of US Government debt is discussed in the next section.
Potential impact on bond yields
According to analysis of International Monetary Fund (IMF) projections, between the pre-GFC period and the end of its forecast horizon in 2029, US sovereign debt as a share of GDP is set to increase by the third most of any of the 40 advanced economies it tracks (after Japan and Singapore). The build-up in US Government debt, if it proceeds at the projected pace, could turn out to be more than what the market is able to handle at prevailing prices and could see bond yields move higher to induce investors to hold these securities.
A glimpse as to what this may look like was evident in August 2023 when the US Treasury announced a higher-than-expected amount of borrowing via long-term bonds. This was one factor behind the steep rise in long‑dated US Treasury bond yields between May and October 2023. Over this period, expectations of policy rates being held at current high levels for longer or possibly being increased further as well as the pricing out rate cuts were likely larger contributors to the rise in yields. However, bond supply concerns seemingly played a role, albeit a smaller one, as did technical market factors (such as investor positioning).
This upward pressure on yields may become more common if the market ultimately absorbs a larger volume of US Treasury bond supply without there being factors inducing an increase in demand. Indeed, a review of the economic literature suggests that higher deficits and debt are associated with an increase in government bond yields.[3]
These studies point to a wide range of possible outcomes for yields in response to higher deficits and debt, though those at the upper end of this range seem implausible. Those at the lower end of the range (which seem more reasonable) suggest that a one percentage point increase in US Government debt could see real US 10-year Treasury yields rise by between two and four basis points. This suggests that yields might be 35 to 70 basis points higher due to the expected worsening in the US’ fiscal position over the next decade than they would be if debt levels were steady.
Alternate scenarios
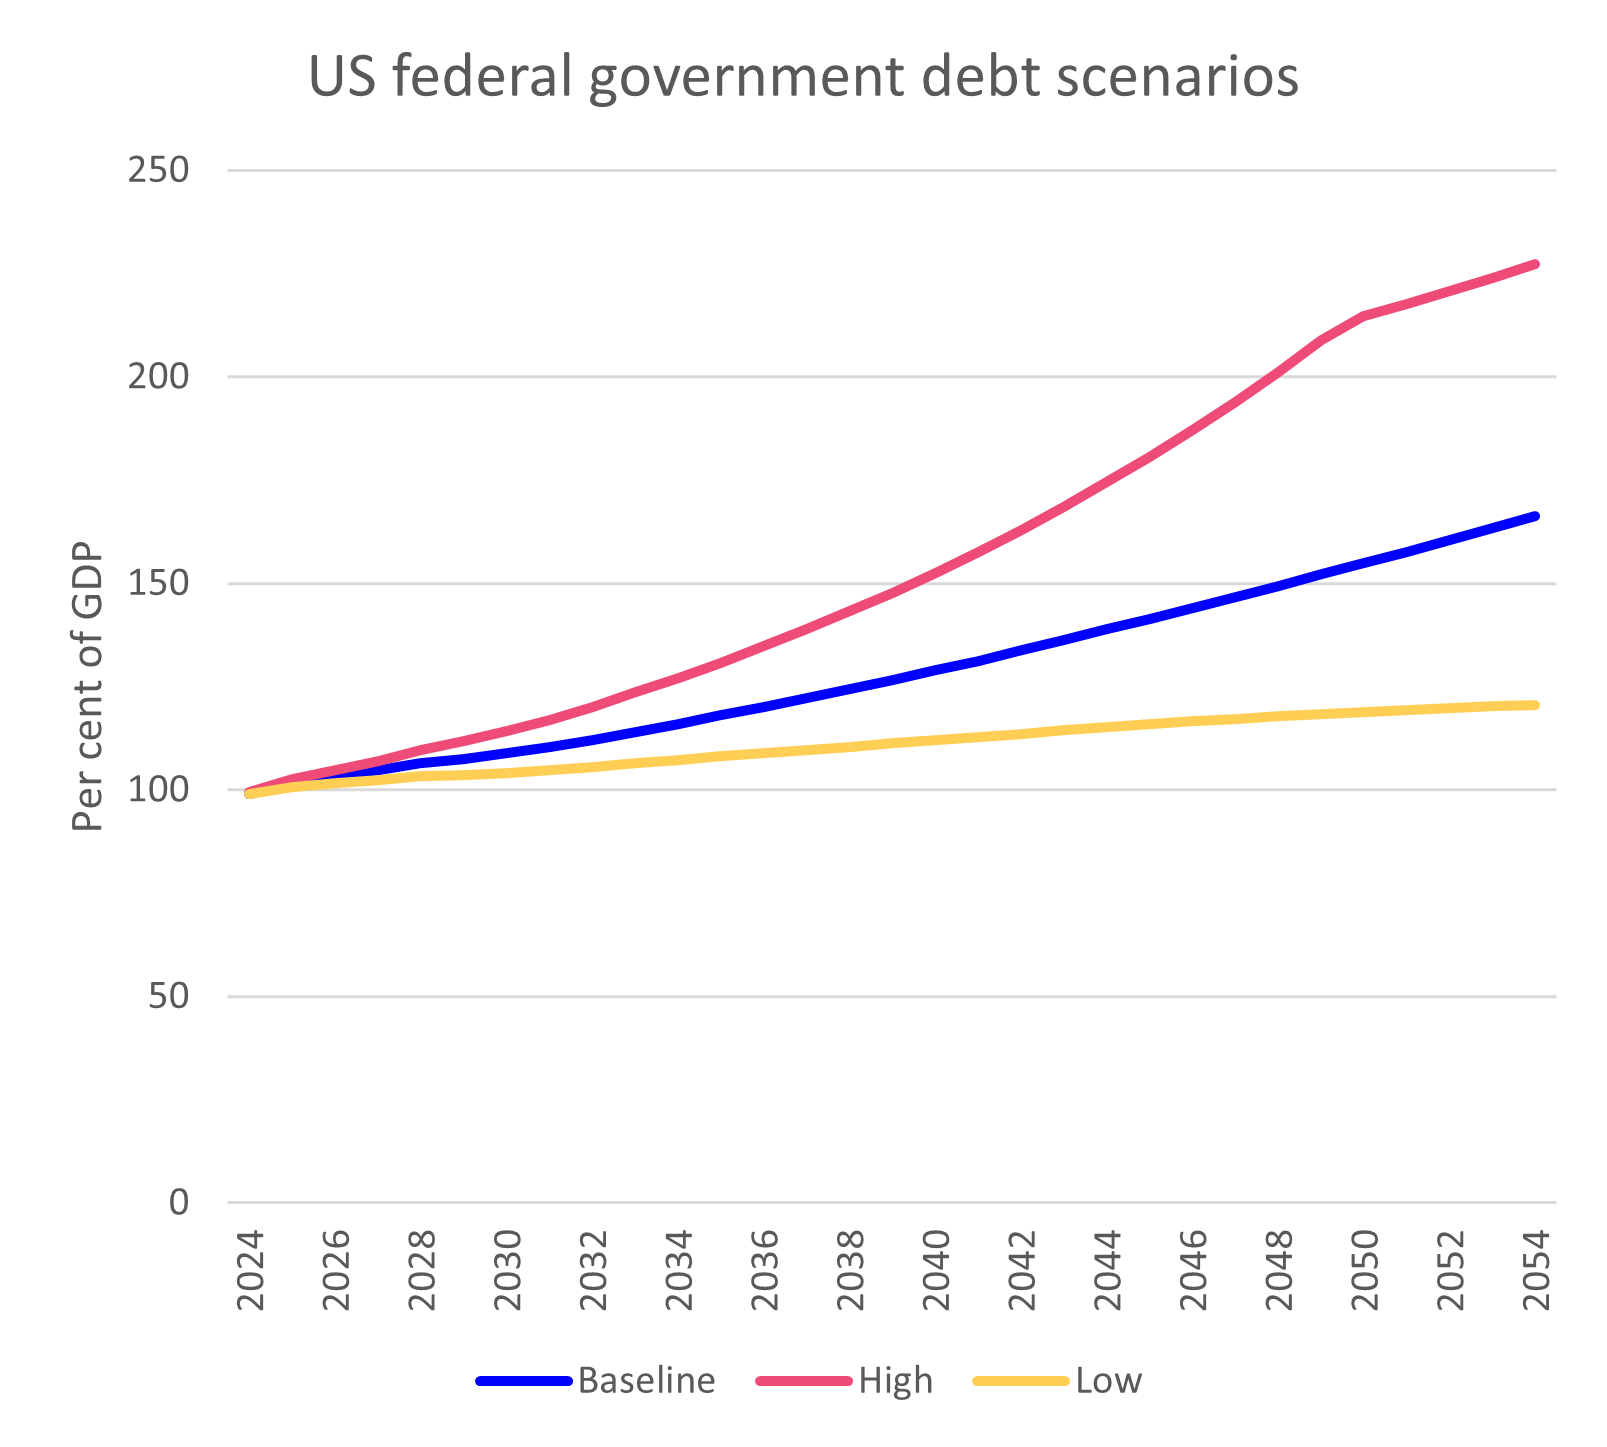
The above estimate of the impact on yields is based on the baseline debt forecasts from the Congressional Budget Office (CBO). But there are plausible scenarios in which these might be higher or lower than projected. It is important to consider these when assessing the potential impact of fiscal outcomes on bond yields. The CBO examined some of these scenarios earlier this year.[4] Debt is higher in all scenarios (Graph 11), it’s just a question of by how much.
Graph 11 – US debt rising under all scenarios…
Source: CBO, QTC Economic Research
Note: While the alternate scenarios were distinct, the average was taken for presentational purposes
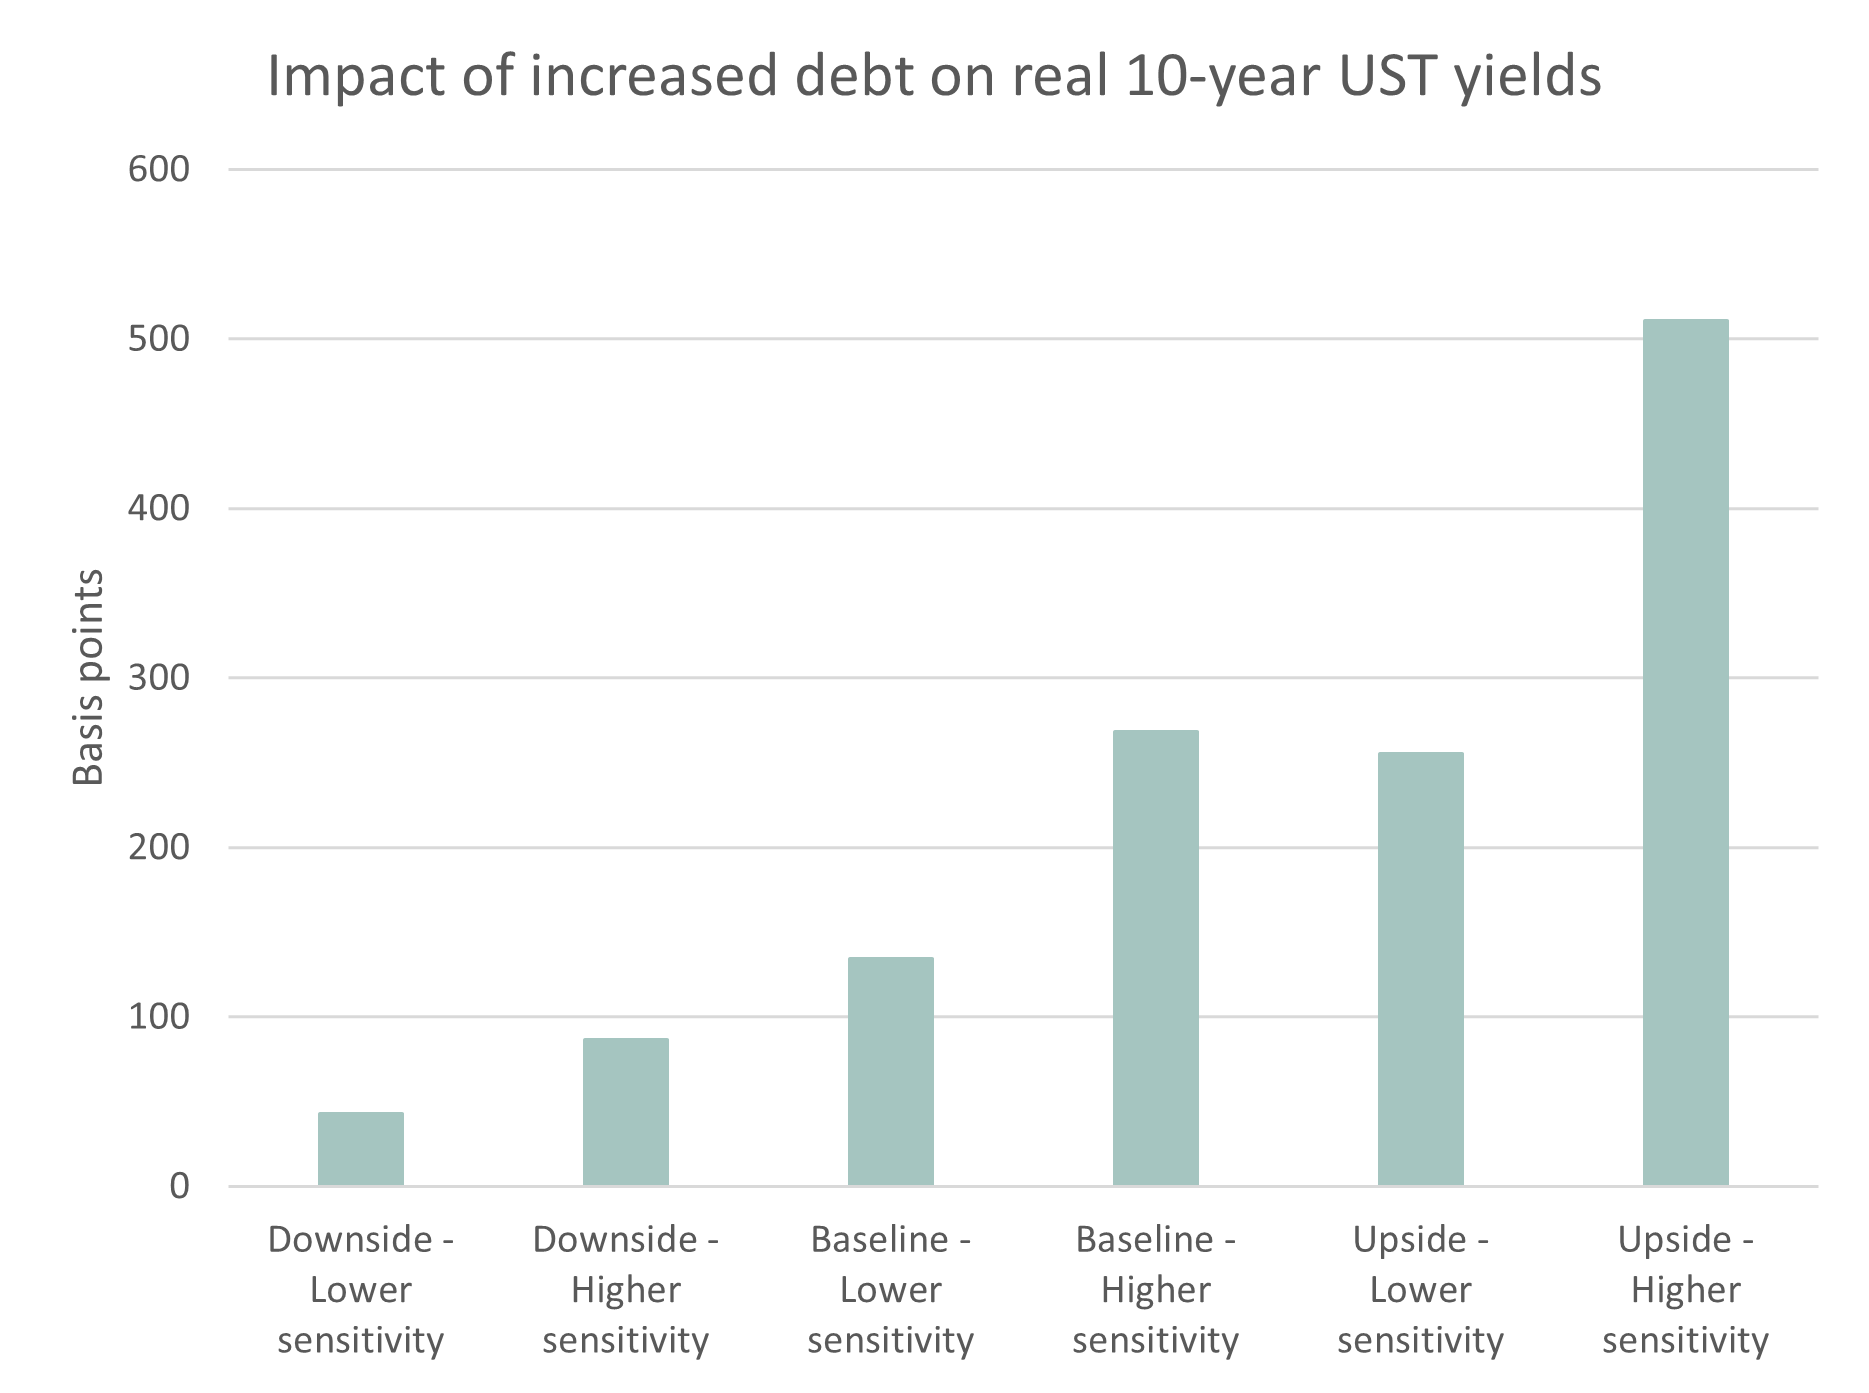
Elevated debt will, all else equal, see higher real 10-year yields with these possibly increasing by as little as ~40 basis points to as much as ~510 basis points over the next 30 years as a result (Graph 12) depending on what scenario plays out for debt levels and based on how sensitive real yields are assumed to be to these changes.
Graph 12 – US debt rising under all scenarios…
Source: CBO, studies listed in appendix, QTC Economic Research
Note: For each of the implied ‘Lower’, ‘Baseline’ and ‘Upper’ CBO scenarios for debt, a lower and upper bound for the impact on yields was assessed based on what were considered the most reasonable estimates in the studies referred to in the Appendix.
Conclusion
The US Government has not been able to consistently balance the budget since the start of the 1960s. This has occurred independently of the economic cycle and at its core, reflects a persistent imbalance between low revenue and high expenses. With spending pressures set to grow due to the ageing of the population and higher interest payments, finding a solution will not be easy. This will be made more complicated by the political environment in the US which has become increasingly partisan in the post-GFC period. However, a policymaker-led solution will make for smoother conditions in government bond markets with an investor-led solution possibly resulting in a destabilising move with higher bond yields, and specifically in the risk premium assigned to US Treasury bonds.
Footnotes
[1] See for example, ‘Macroeconomic Policy In The 1960s: The Causes And Consequences Of A Mistaken Revolution’ by Christina Romer.
[2] For example, corrective actions to reduce budget deficits (or run surpluses) would be the most effective. Financial repression measures such as yield caps could also be used. Developments outside the control of policymakers such as unanticipated inflation or an acceleration in the economy’s growth potential would also be helpful in lowering debt.
[3] See the appendix for details of some of these studies.
[4] See for example, ‘The Long-Term Budget Outlook Under Alternative Scenarios for the Economy and the Budget’ (CBO, May 2024).
